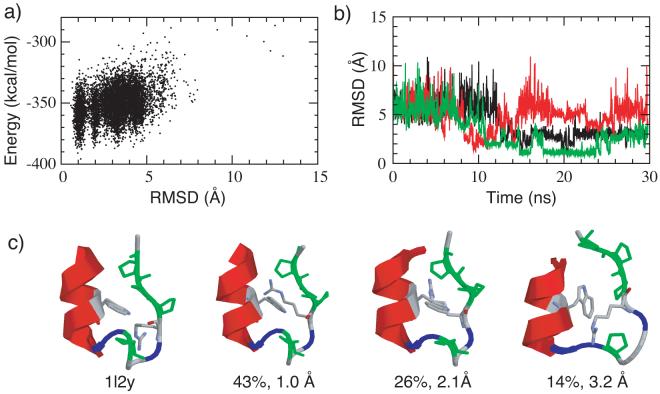
Figure 7.
(a) Potential energy versus Cα RMSD plot from a REX-MD folding simulations of mini-protein Trp-cage. All snapshots from the lowest temperature ensembles at 270 K are included. (b) Cα RMSD versus time for three of the replicas from that successfully folded. Note that one of the replica unfolded later during the simulation. (c) Representative folded and misfolded structures in comparison with the average NMR structure (PDB ID: 1l2y). Proline residues are colored green and glycine residues are colored blue. The structures shown are the centroids of the largest clusters from the last 10 ns of the simulation. The occupancies and backbone RMSD values are shown in the figure. The heavy atom RMSD values (backbone plus the hydrophobic sidechains from tryptophan and proline residues) from the NMR structure are 0.98 Å, 2.08 Å and 3.78 Å respectively (left to right).

