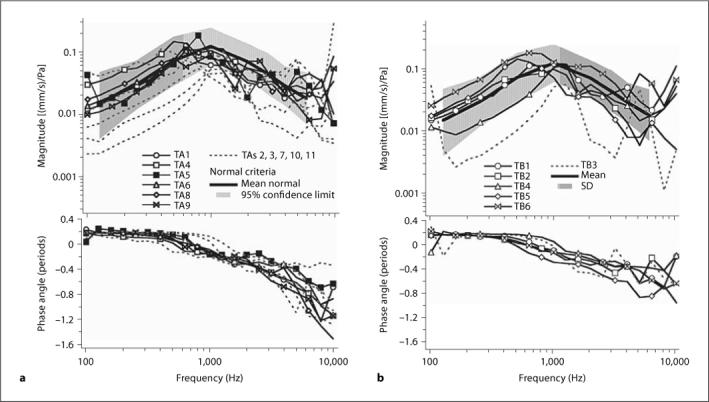
Fig. 3.

Measurements of middle ear transfer function, HTV, in test ears compared to the ‘normal’ criterion range. a Comparison of the 11 cadaver ears used to test IMEHD-A. b The 6 cadaver ears used to test IMEHD-B. The magnitude of the transfer function and the criterion are illustrated in the upper panels. The phases of the transfer functions are illustrated in the lower panels. a Measurements in 6 of the 11 ears used for testing IMEHD-A were judged to fit within the criteria (black lines and symbols). Measurements in 5 ears were clearly outside the magnitude criteria at multiple frequencies (dashed gray lines). Comparisons of the phases of the velocity transfer function show little differences in the pattern of those ears that did or did not fit within the magnitude criterion. b Measurements in 5 of the 6 ears used for testing IMEHD-B were judged to fit within the criteria (black lines and symbols).
