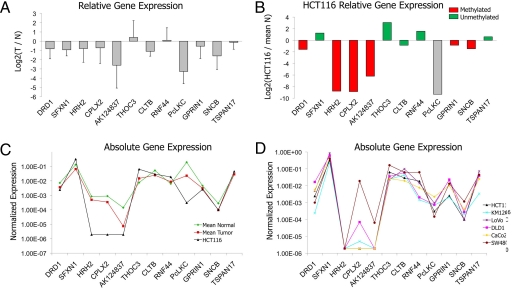
Fig. 2.
Gene expression and promoter DNA methylation status of 12 genes across 5q35.2 in normal-tumor pairs and colon cancer cell lines. (A) Mean expression values (log2 of the tumor/normal ratio) of a series of 16 normal-tumor pairs. Error bars indicate standard deviation. Most genes were down-regulated in tumor samples. Individual data are illustrated in Fig. S3. (B) Relative expression of the 12 genes in HCT116 cells respectively, compared with the mean of 16 normal colonic mucosa samples. Bar color represents the methylation status of the respective promoter in HCT116 cells, except for PcLKC, that does not have a promoter CpG island. (C) Mean absolute expression values across the 12 genes analyzed for the 16 normal tissues (green), the 16 tumor tissues (red), and the HCT116 cell line (black). (D) Absolute gene expression values in six colon cancer cell lines.

