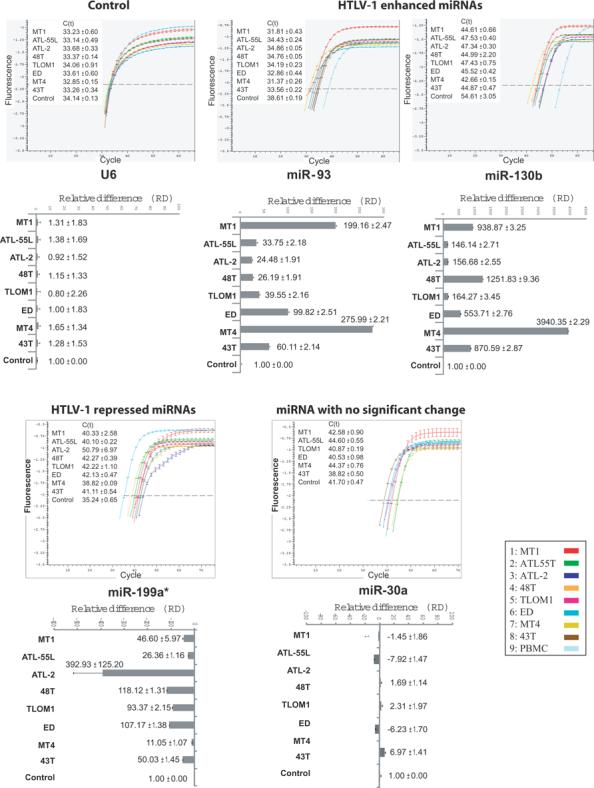
Figure 2. Real-time PCR confirmation of the up-regulated miRNAs expression in HTLV-1 transformed cell lines.

The HTLV-1 altered miRNAs were verified by quantitative real-time PCR using U6 small RNA as a normalization control. Shown are miR-93, miR-130b, miR-199a* whose level was repressed in ATL cells, and miR30a whose level was not significantly changed in ATL cells. The upper panels show the qRT-PCR profiles and the lower panels show the relative differences (RD) and Ct +/− standard deviations of the samples after normalization to the corresponding miRNAs from normal PBMCs and cord blood cells as described in the text.
