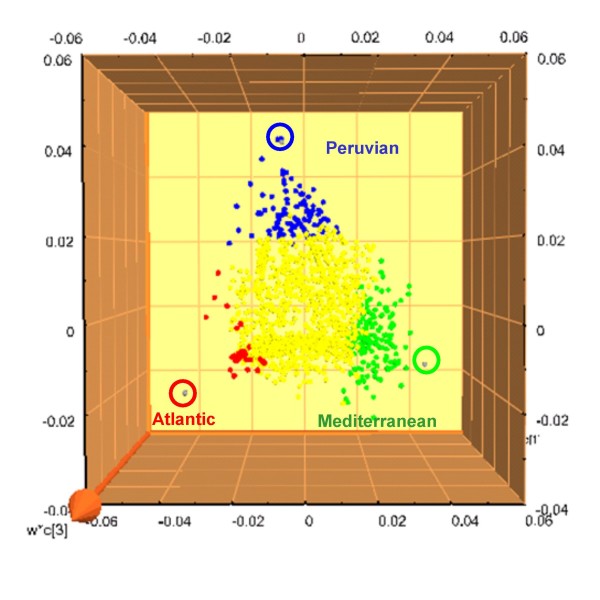
Figure 4.
Plot correlating the 2099 m/z values of known elementary composition to the geographical origins of isolation of the analyzed S. ruber strains. The m/z values having a high correlation with geographical origin are highlighted in red, blue or green while the nondiscriminating masses are represented in yellow.

