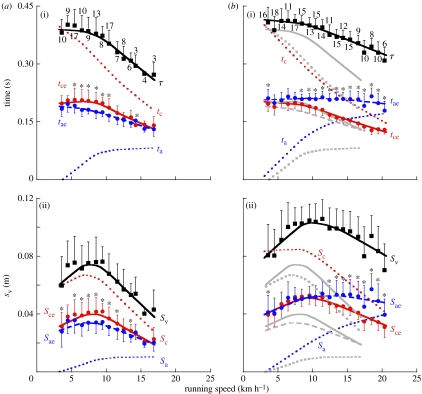
Figure 1.
(a) Old subjects. (b) Young subjects, with superposed old subject lines (grey lines) for comparison. (a(i),b(i) indicate the step period (τ, black filled squares) and its fractions). (a(ii), b(ii) indicate the total vertical displacement during the step (Sv, black filled squares) and its fractions). The red circles indicate the duration of the effective contact phase when the vertical force is greater than body weight (tce), and the vertical displacement during this phase (Sce, which represents the amplitude of the oscillation in the spring–mass model of running, Cavagna et al. (1988)). The blue circles indicate the duration of the effective aerial phase when the vertical force is lower than body weight (tae) and the vertical displacement during this phase (Sae). The red dotted line indicates the contact time (tc) and the vertical displacement (Sc) during it. The blue dotted line indicates the aerial time (ta) and the vertical displacement (Sa) during it. The vertical bars indicate the s.d.±mean; the values near the symbols in (a(i),b(i)) indicate the number of items in the mean. Asterisks denote statistically significant difference at p<0.05 between variables within each subject group. Lines represent the weighted mean of all the data (KaleidaGraph v. 4.0.3), their only purpose is to be a guide for the eye: they do not describe the underlying physical mechanism. Note that both the step period τ and the amplitude of the oscillation Sce are smaller in the old than in the young subjects, whereas the time of contact tc and the effective contact time tce are about the same. This indicates that the fraction of the step during which the vertical force exceeds body weight is greater in the old subjects. The similar effective contact time tce in old and young subjects indicates a bouncing system having the same natural frequency (figure 2), with lower amplitude of the oscillation Sce in the old subjects.

