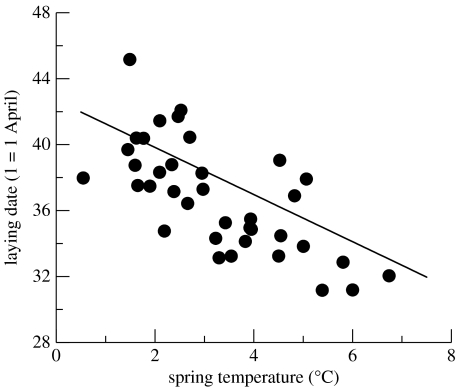
Figure 1.
Annual mean laying dates for 1968–2006 (except 1984 and 1985) plotted against the annual mean temperature during the period that showed the highest correlation with the mean laying date. Laying date is expressed in April days (1 April=1, 1 May=31). The plotted line shows the fixed-effect elevation (laying date at mean temperature of 3.27 °C) and slope (−1.43 d °C−1) fitted using a REML mixed modelling procedure described in table 1 and the text.

