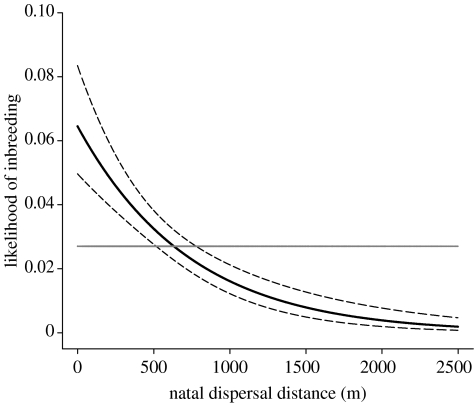
Figure 3.
The likelihood of mating with kin decreases with respect to natal dispersal distance (m). The bold line shows the fitted values from a GLM with binomial errors where natal dispersal distance was fitted as a predictor to inbreeding (f≥0.03125); dashed lines show the 95% CI for the fit. The horizontal line represents the overall population average likelihood of inbreeding.

