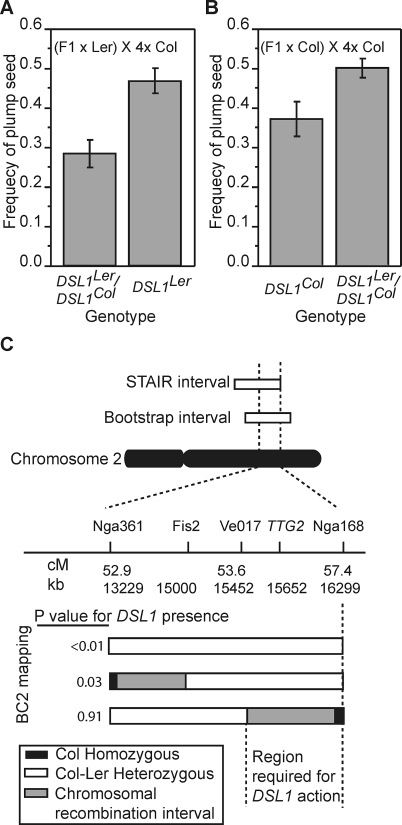
Figure 3. Fine Mapping of DSL1 .
(A and B) The mean frequencies of plump seed (y-axis, error bars indicate the standard deviations) in BC1 families from F1 × Ler (A) and F1 × Col (B) BC1 families genotyped at the FIS2 marker (x-axis) and crossed to 4x Col. Heterozygotes and homozygotes were different as determined by t-test at p < 0.05 in both populations.
(C) Illustrations of the genotype of BC2 families (grey, white, and black boxes) segregating for chromosomes recombinant within the DSL1 interval. The p-values to the right of the illustrations indicate whether segregation of that interval resulted in segregation of the DSL1 QTL as determined by t-tests comparing the mean proportion of plump seed in progeny of crosses between 4x Col and BC2 seed-parents heterozygous or homozygous for segregating molecular markers.

