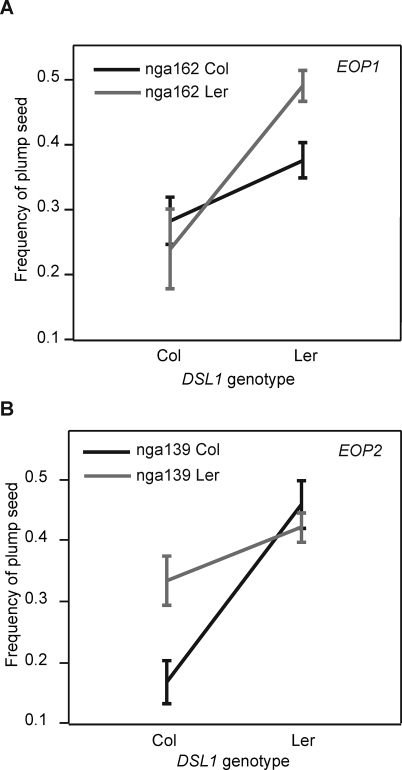
Figure 4. DSL1 Interacts with at Least Two Loci to Control the Interploidy Hybridization Barrier.
The genotype at marker g17288, which had the highest likelihood ratio in the RIL population, was used for the DSL1 genotype on the x-axis. The y-axis corresponds to the mean frequency of plump seed for each genotype. Error bars indicate the standard deviation from the mean. The grey and black lines correspond to the Ler and Col alleles of nga162 at the position of EOP1 on chromosome 3 (A) and nga139 at the position of EOP2 on chromosome 5 (B).

