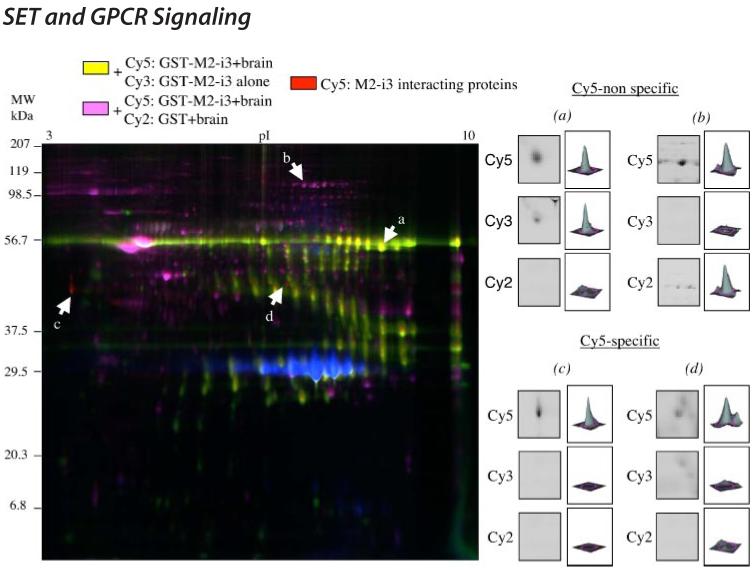
FIGURE 2. Visualization of M2-i3 interacting proteins.
Left panel, representative image of the three labeled samples after separation on the same gel matrix. The merged colors, yellow and purple (spots a and b) correspond to proteins that appear in the Cy5 channel and in the Cy3 or Cy2 channels, respectively. The red spots correspond to proteins that appear only in the Cy5 channel (spots c and d). Right panel, quantification of spots a and b (Cy5-nonspecific) and c and d (Cy5-specific) with the DeCyder differential analysis software DIA, Version 5.0 (GE Healthcare). For each spot an enlarged area of the gel where the spot is located is shown in all three channels. The histograms represent the volume of each spot determined with the DIA software.

