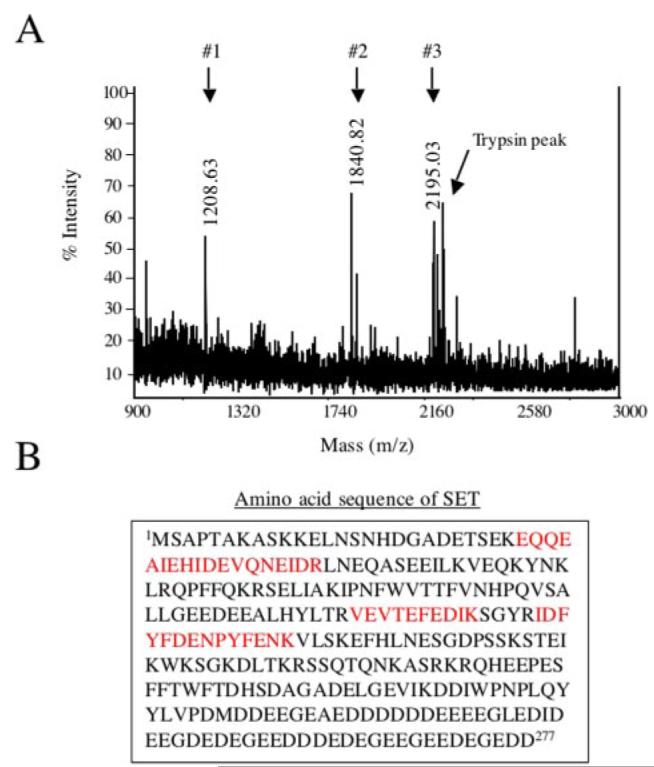
FIGURE 3. Identification of SET by MALDI TOF mass spectrometry.

A, mass spectra profile of spot c. The CyDye fluorophore-labeled protein gel was post-stained with Sypro Ruby, and spot c was picked, trypsin-digested, and analyzed by MALDI-TOF mass spectrometry (see “Experimental Procedures”). Three major distinct peaks were obtained (#1–3) corresponding to three peptides with a mass (m/z) of 1208.63, 1840.82, or 2195.03. These peptides were subjected to tandem mass spectrometry analysis, and the sequences obtained were used to interrogate sequences entered in the non-redundant SWISS-PROT and NCBI databases using MASCOT. B, protein identified by mass spectrometry. Spot c was identified as SET. The three peptides in red correspond to the peptides identified by mass spectrometry that matched with the amino acid sequence of rat SET. No protein was identified for spot d.
