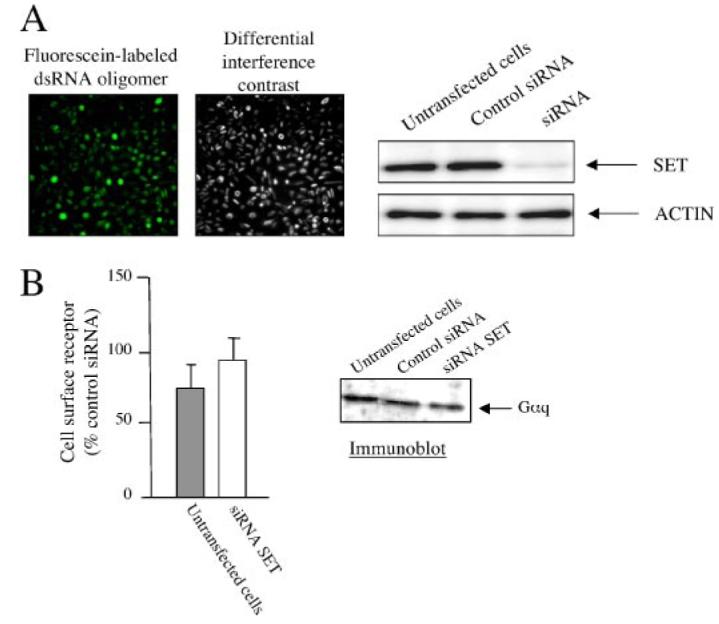
FIGURE 7. SET knock down in CHO-M3 cells.

A, left panel, to assess the siRNA transfection efficiency, a fluorescein-labeled double-stranded RNA oligomer (Invitrogen) was transfected in parallel with siRNA in CHO-M3 cells, and cell fluorescence uptake was assessed 72 h after transfection. Magnification,10×. Right panel,12 μg of protein homogenates from CHO-M3 cells transfected or not with control siRNA or siRNA SET were electrophoresed on denaturing polyacrylamide gels (10%),and membrane transfers were probed with anti-SET or anti-actin antibodies. B, effect of SET siRNA knockdown on the expression of M3-MR (left panel) and Gαq (right panel). M3-MR cell surface expression was measured by radioligand binding (n = 3, means ± S.E., control siRNA, 32,159 ± 1,940 disintegrations/min/well). αq protein expression was assessed by immunoblotting CHO-M3 cell homogenates. See “Experimental Procedures.”
