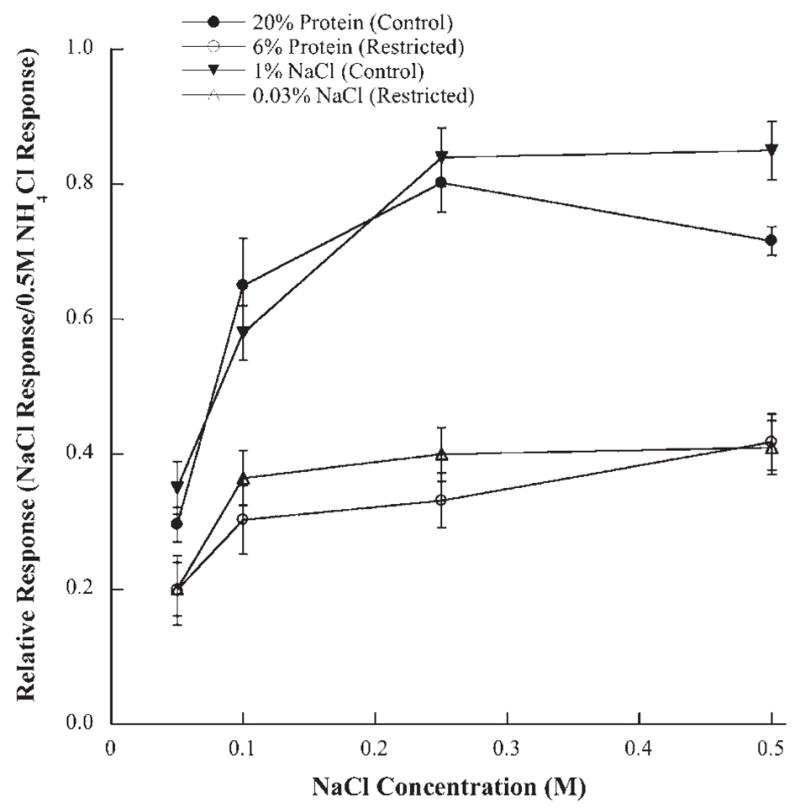
Fig. 7.

Mean (±S.E.M.) chorda tympani responses to a concentration series of NaCl from rats restricted of protein (6% protein; open circles) or of NaCl (0.03% NaCl; open triangles) compared with their respective control groups (20% protein; solid circles: 1% NaCl; solid triangles). All of the mean responses from the control groups are significantly higher than those from the respective dietary restriction group (P < 0.05).
