Fig. 10.

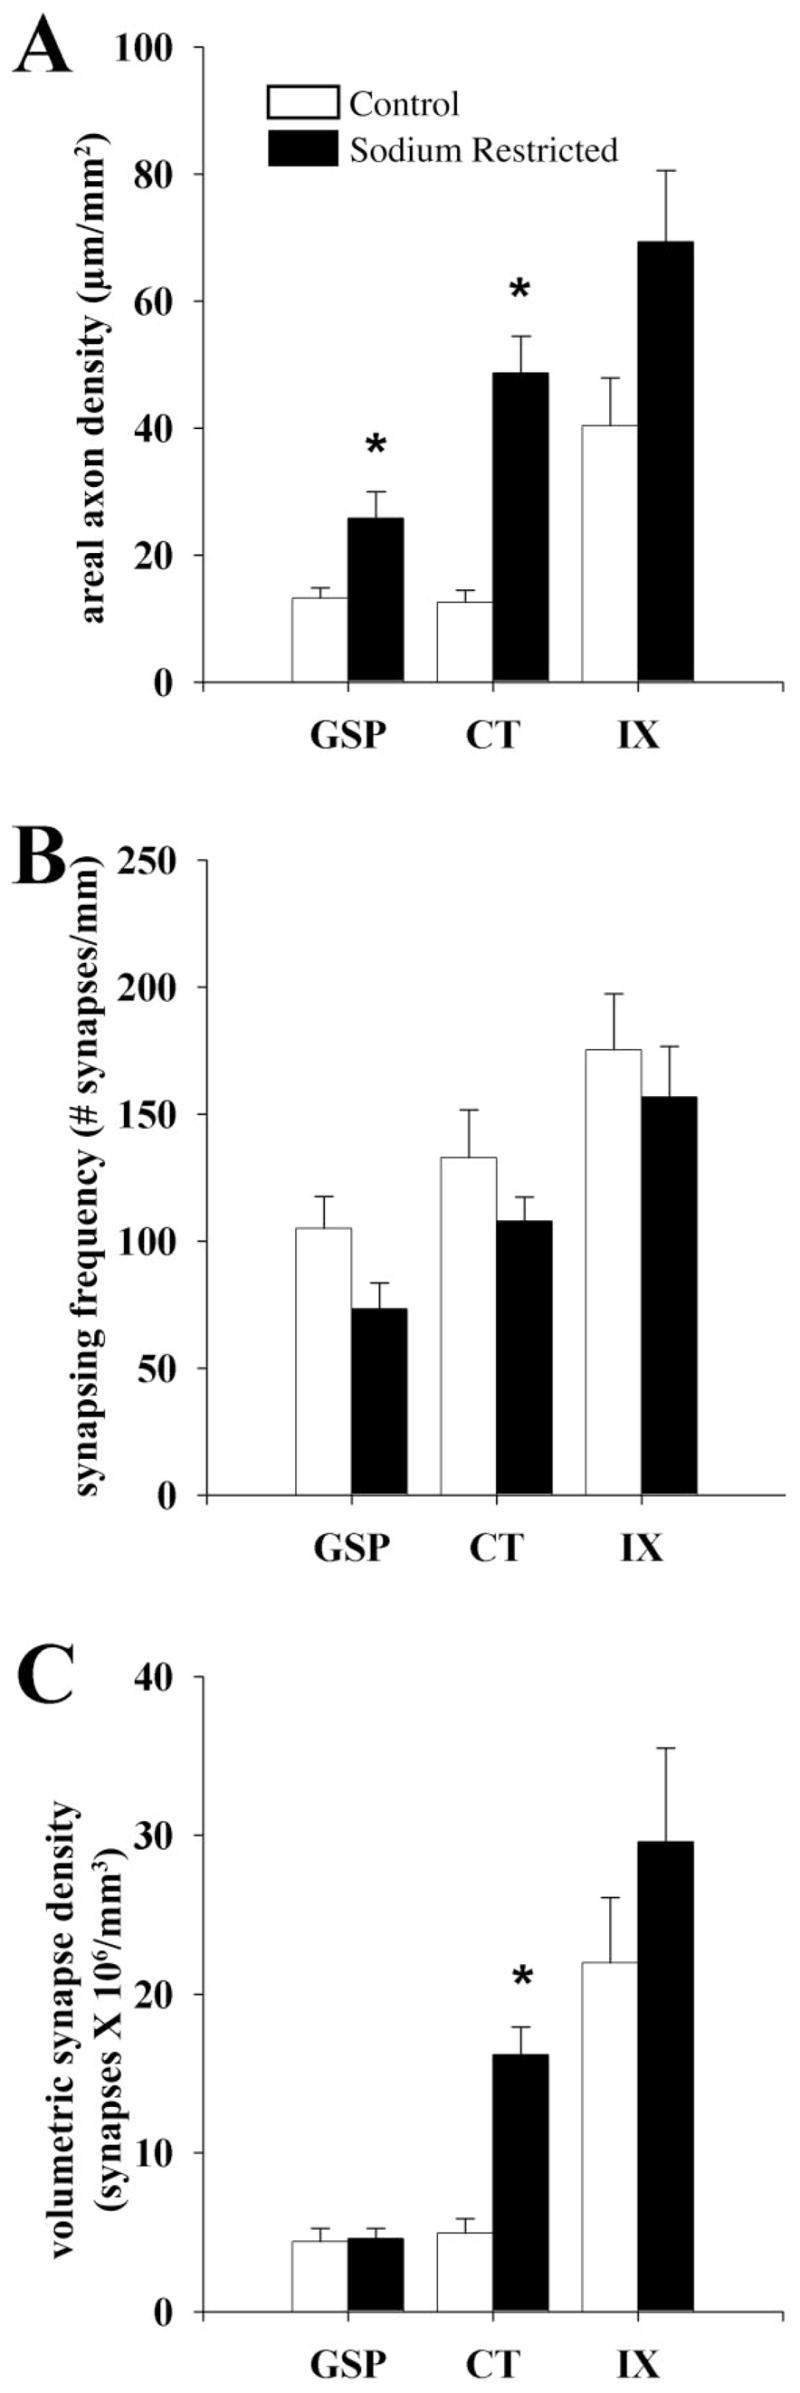
A: Areal axon density of GSP, CT, and IX axons in control (open bars) and sodium-restricted (solid bars) rats per mm2 of the dorsal NTS. Compared to controls the total axon densities of GSP and CT axons were significantly denser upon dietary manipulation (asterisks indicate a statistical significance of P < 0.02). However, the CT and IX axons of sodium-restricted rats were denser than GSP axons located in the same region (significance not shown; P < 0.02). B: Synapsing frequency of DAB-labeled GSP, CT, and IX axon in control (open bars) and sodium-restricted (solid bars) rats. (See Results for interpretation.) Synapses occurred with similar frequency on GSP, CT, and IX axons in sodium-restricted rats compared to controls. However, in comparing the synapse frequency between gustatory axons in sodium-restricted rats, IX axons formed synapses at a significantly higher frequency than GSP and CT axons (significance not shown; P < 0.02). C: Volumetric density of synapses associated with GSP, CT, and IX axons in control (open bars) and sodium-restricted (closed bars) rats. Dietary sodium manipulation resulted in a significant 4-fold increase in the number of synapses present on CT axons compared to controls (asterisk indicates a statistical significance of P < 0.02). In the NTS of sodium-restricted rats, significantly more synapses were associated with CT and IX axons compared to GSP axons (significance not shown; P < 0.02). See Materials and Methods for calculations. Error bars indicate standard error.
