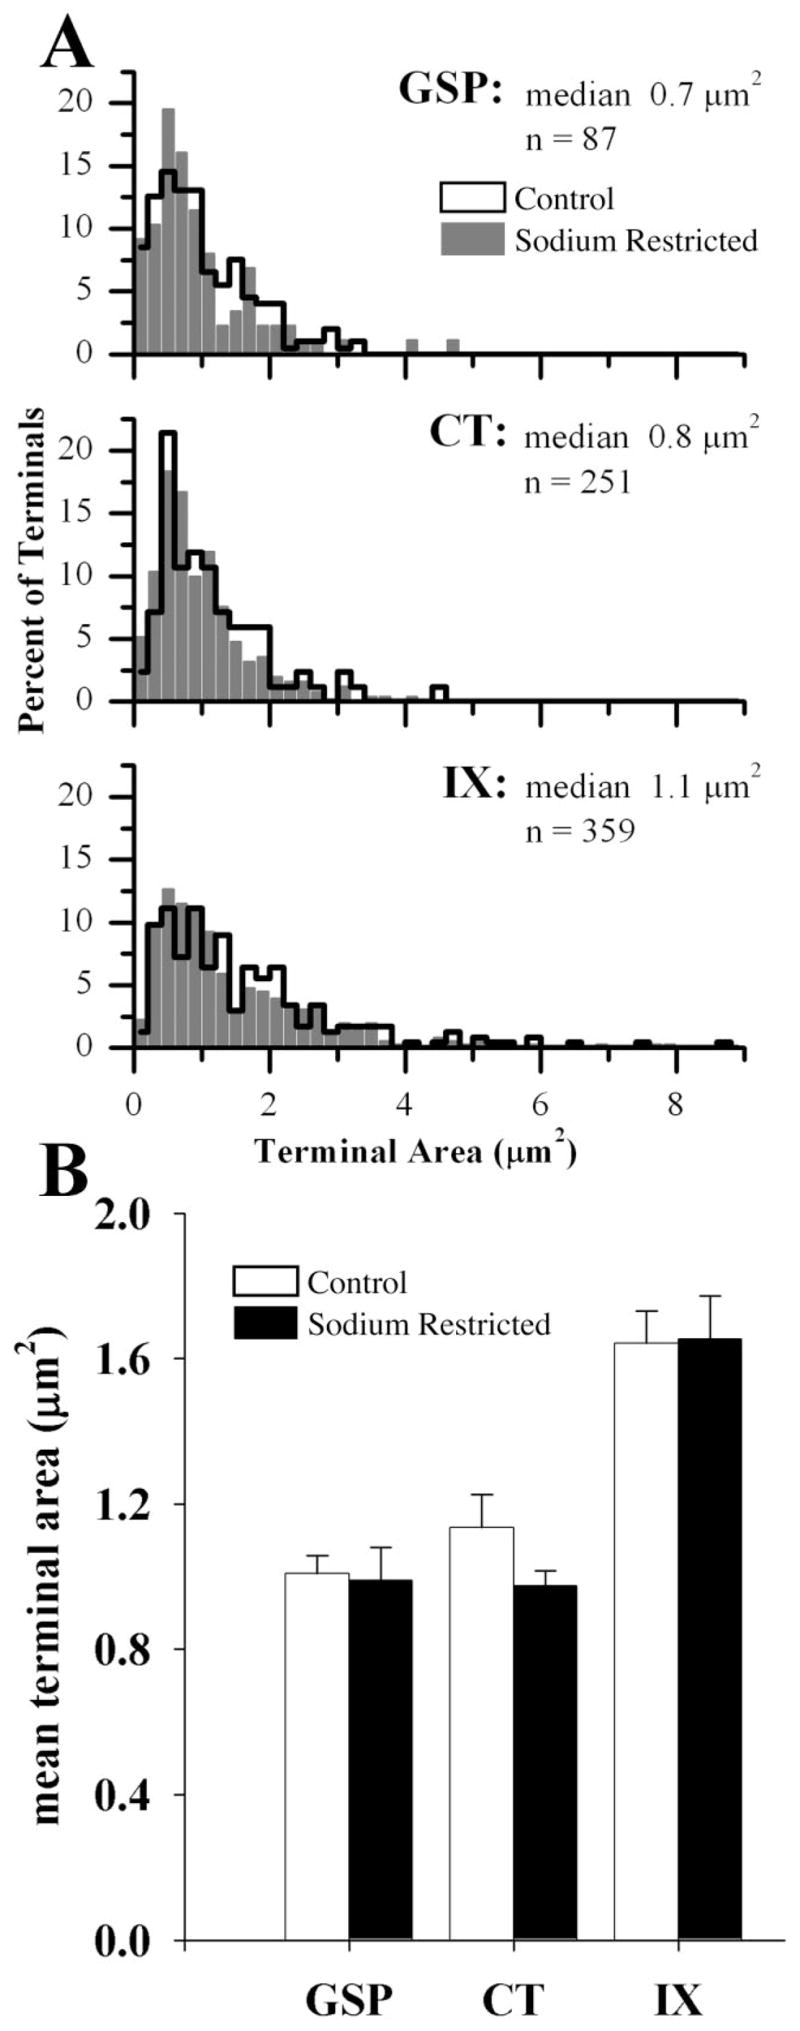
Fig. 6.

A: Frequency distribution histogram of the terminal areas of GSP, CT, and IX axon terminals in control (outline) and sodium-restricted (solid gray bars) rats. Frequencies for each nerve are displayed as a percentage of the total to allow visual comparison between groups. Median and population size (n) are indicated for each nerve in sodium-restricted rats. B: Mean terminal area (μm2) of GSP, CT, and IX axon terminals in control (open bars) and sodium-restricted (solid bars) rats. In comparing sodium-restricted rats to controls, terminal areas associated with GSP, CT, and IX axon terminals were similar. In comparing the three gustatory afferent nerves within sodium-restricted rats, terminal areas found on IX axon terminals were significantly larger than terminals on GSP and CT terminals (significance not shown on graph). The IX axon terminals were also larger than terminals on GSP and CT terminals for controls (significance not shown on graph). Error bars indicate standard error.
