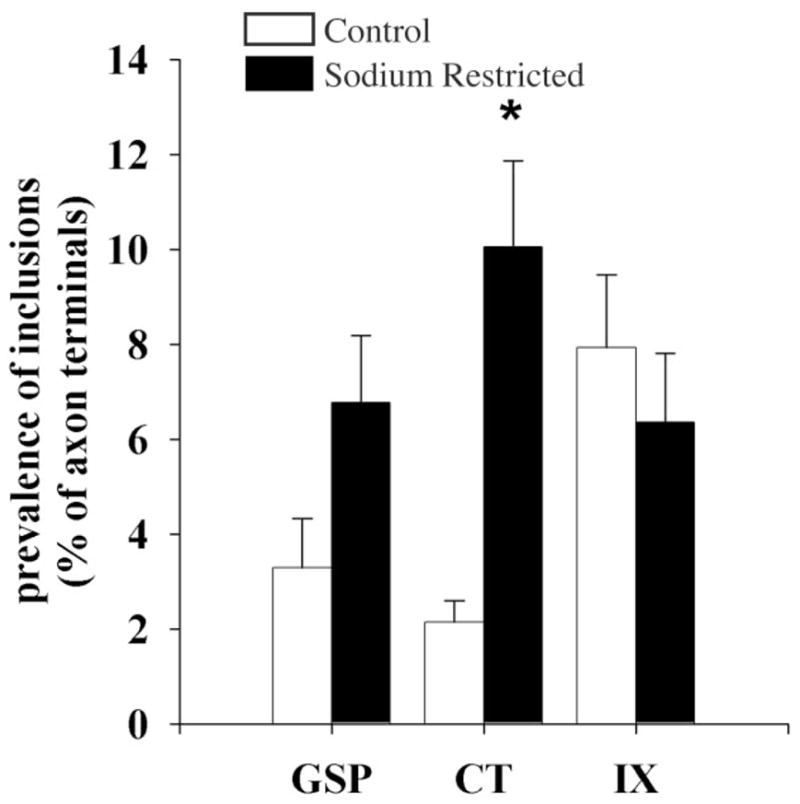
Fig. 9.

Mean percentage of GSP, CT, and IX axon terminals in control (open bars) and sodium-restricted (solid bars) rats that contained unlabeled inclusions. In sodium-restricted rats CT terminals contained significantly more of these inclusions than controls (asterisk indicates a statistical significance of P < 0.02). Error bars indicate standard error.
