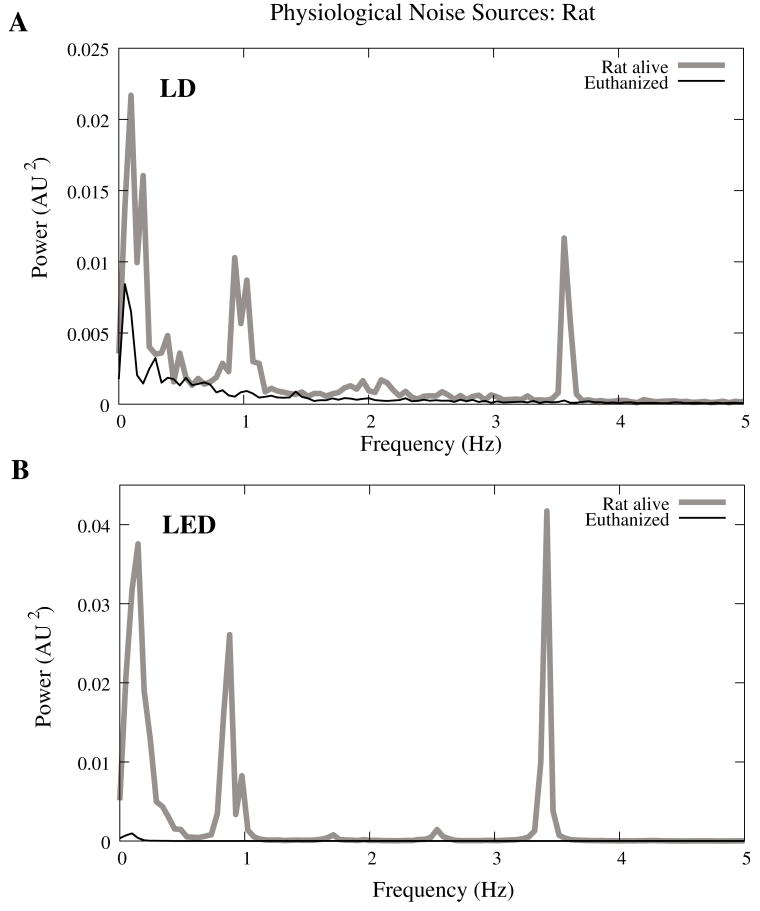
Figure 4.
Power spectra of optical signals in−vivo with an LED (A) and LD (B) source. Both spectra feature peaks that correspond to 1/f, respiratory (0.9 Hz), and cardiac signatures (3.5 Hz). Since low frequency components below 0.5 Hz are greater in the live rat, we assume slow vascular oscillations (Mayer waves) may contribute to noise in this frequency range.

