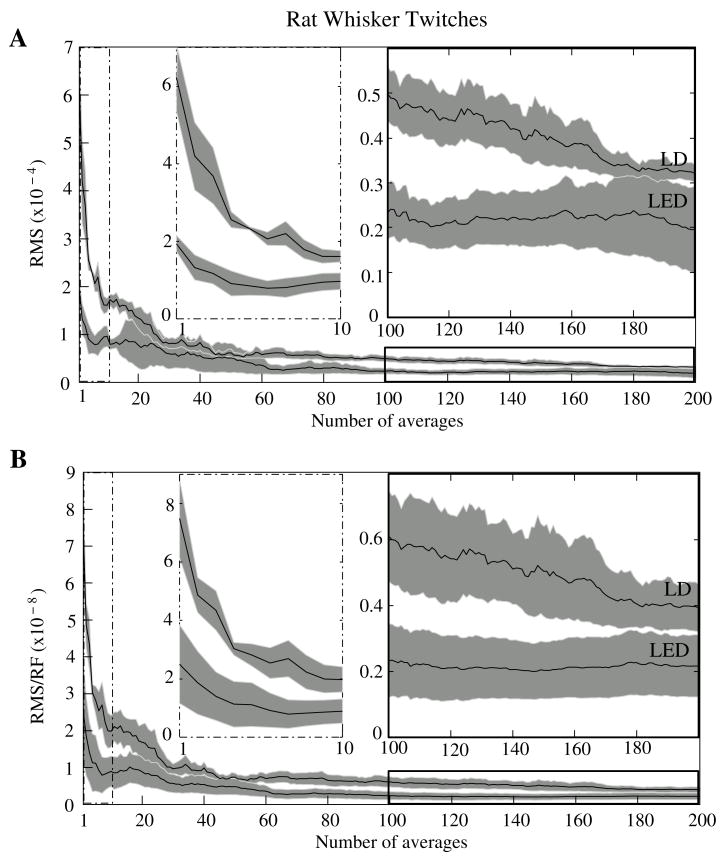
Figure 9.
RMS noise across averages in−vivo during rat whisker twitches. Panel A shows the mean (black line) and standard error (gray background) for RMS noise in cardiac−subtracted hemodynamic signals for the LED and LD from 1 to 200 averages. The same is shown in Panel B, except that the RMS has been normalized to the radiant flux of each source. Measured baseline radiant power in−vivo was 0.84 – 1.27 μW for the LD and 0.81 – 2.07 μW for the LED.

