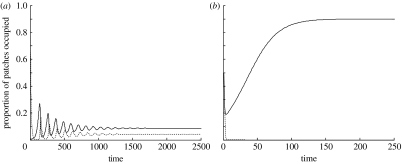
Figure 2.
(a,b) Two example dynamics of the system. The proportion of patches occupied by sexuals only (p) is represented by the solid line, while the dashed line represents the proportion of patches colonized by both sexuals and asexuals (q). In (a) there is stable coexistence between sexuals and asexuals (extinction rate for patches containing both sexuals and asexuals eB=0.25), while in (b) the asexuals are driven extinct, and only patches containing the sexual species remain (extinction rate for patches containing both sexuals and asexuals is very high, eB=2.0). Other parameters used in the figure are eA=0.01, eS=0.01, α=1, β=1, cS=0.1 and cA=2.

