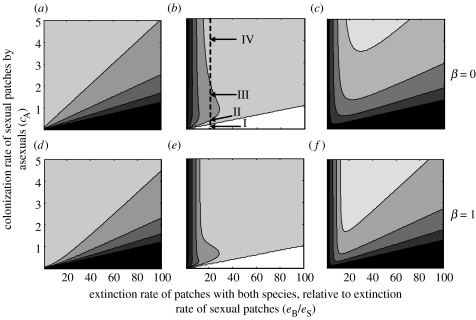
Figure 3.
Contour plots showing the proportion of patches occupied by (a,d) sexuals only, (b,e) asexual parasites and sexuals together (both) and (c,f) the total proportion of occupied patches (all fish). The dashed line in (b), and the points indicated (I–IV), represents a cross section detailing what happens when the colonization rate of asexuals increases. Shading indicates proportions from white to black as follows: 0 (white), less than 0.2, 0.4, 0.6, 0.8 and less than 1 (black). In (a–c), Amazons and sexuals cannot colonize patches together (β=0), while in (d–f) they can (β=1). Other parameters used in the figures are eA=0.01, eS=0.01, α=0.5 and cS=0.3.

