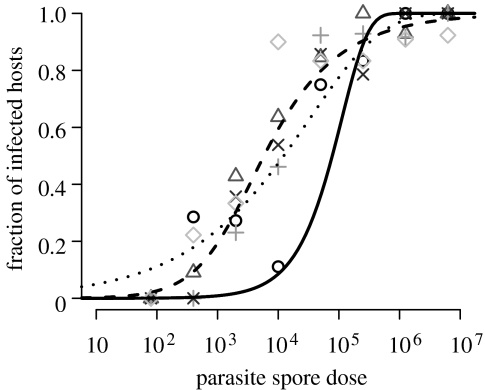
Figure 1.
Plot of the proportion of infected hosts in relation to the parasite spore dose used. Each symbol represents a host–parasite combination (circles, HO2+P1; triangles, HO2+P4; pluses, M10+P1; crosses, M10+P4 and diamonds, DG+P1). The solid, dotted and dashed lines represent the fits of the mass-action infection, parasite antagonism and heterogeneous host models, respectively.

