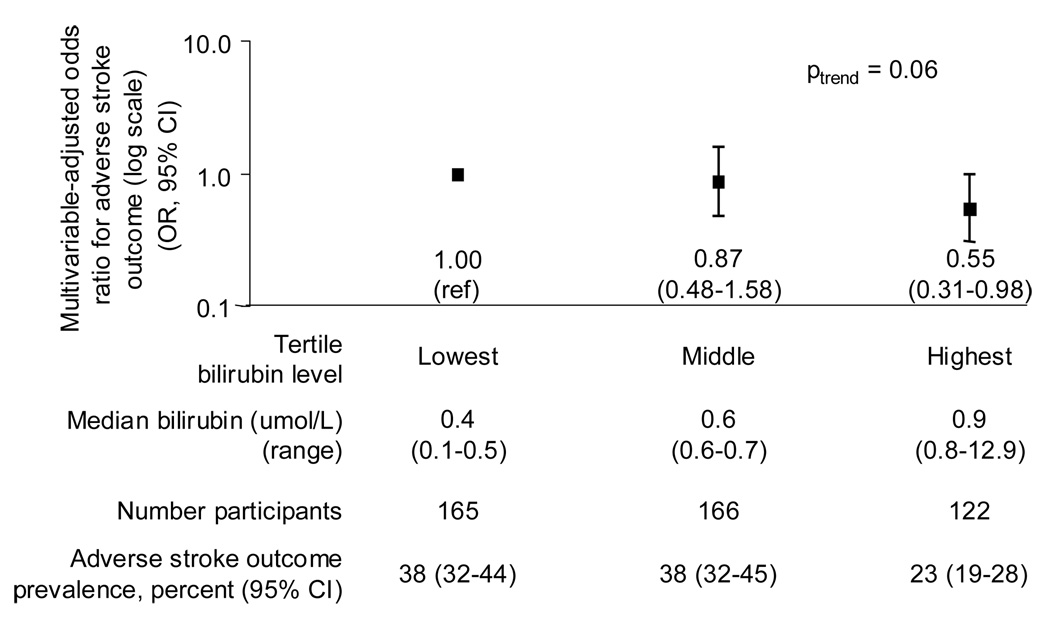
Figure 3. Multivariable-adjusted odds of an adverse stroke outcome among stroke survivors.
Age, sex, race/ethnicity, smoking, hypertension, total:HDL cholesterol ratio, and diabetes were adjusted for. Odds ratios and 95% confidence intervals (CI) estimated by logistic regression. Y-axis is log scale. The adverse stroke outcome prevalence estimates are unadjusted. To convert bilirubin from umol/L to mg/dL, multiply by 0.058. National Health and Nutrition Examination Survey 1999–2004. OR : Odds ratio. CI : Confidence interval.

