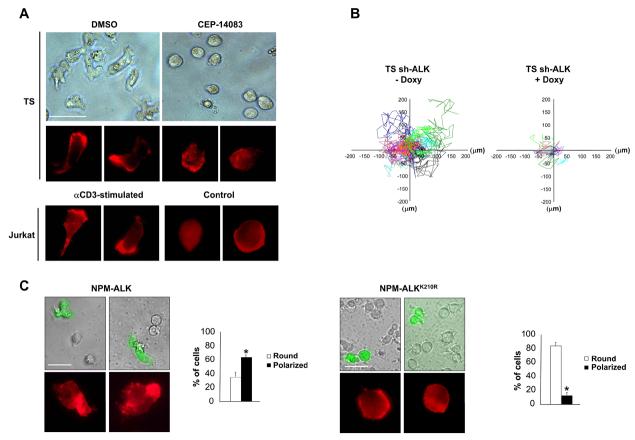
Figure 1. NPM-ALK induces an activated phenotype in ALCL cells.
A, TS were treated with 300nM ALK inhibitor CEP-14083 for two hours, whereas Jurkat cells were stimulated with immobilized anti-CD3ε antibody (10μg/ml) for 48 hours. Cell morphology was evaluated by contrast phase imaging (top panels) or by immunofluorescence using PE-conjugated phalloidin staining to detect actin filaments (bottom panels). White bars, 50 μm. B, inducible sh-ALK TS cells were treated with 1 μg/ml doxy for 84 hours. The movements of the membrane protrusions of single cells were traced for at least 8 hours at 5 minutes intervals. Graphs of the movements from 10 representative cells are depicted with different colour coded lines for each different cell. Path lengths in both axes are measured in microns (μm). C, MAC-1 cells were transduced with NPM-ALK or NPM-ALKK210R retroviruses carrying EGFP as a reporter. Cell morphology was evaluated by contrast phase imaging with overlaying fluorescence imaging for EGFP or by immunofluorescence using PE-conjugated phalloidin staining to detect actin filaments (top panels). White bars, 50 μm. Histograms (bottom panels) represent the percentages of round versus polarized MAC-1 cells transduced either with NPM-ALK or NPM-ALKK210R, quantified by counting at least 100 EGFP positive cells for each condition. Data are represented as mean +/− SD. * p < 0.005. Data are from three independent experiments.

