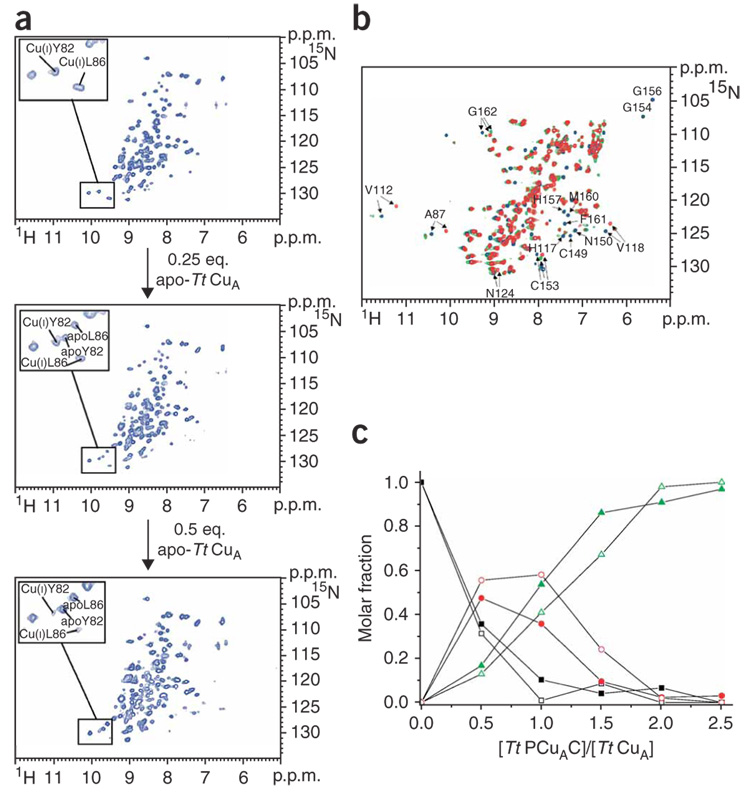
Figure 2. Cu(I) transfer reaction between Cu(I)–Tt PCuAC and apo-Tt CuA.
(a) Titration of 15N-labeled Cu(I)–Tt PCuAC with unlabeled apo-Tt CuA followed by 1H-15N HSQC experiments. In the insets, residues followed to map the metal exchange reaction are shown. (b) Overlay of the 1H-15N HSQC spectra of 15N apo-Tt CuA (red), and after addition of one (green) and two (blue) equivalents of unlabeled Cu(I)–Tt PCuAC. Some residues indicating the formation of Cu(I)2–Tt CuA and of a partially metallated CuA species are labeled. (c) Plot showing the relative concentrations of Cu(I)2–Tt CuA (green), the partially metallated CuA protein (red) and apo-Tt CuA (black) as a function of the Tt PCuAC/Tt CuA molar ratio. The signals of residues Cys153 (solid symbols) and Gly162 (open symbols) (whose 1H-15N chemical shifts substantially change depending on the metallation state of Tt CuA) have been selected to evaluate the molar fractions of Tt CuA forms.

