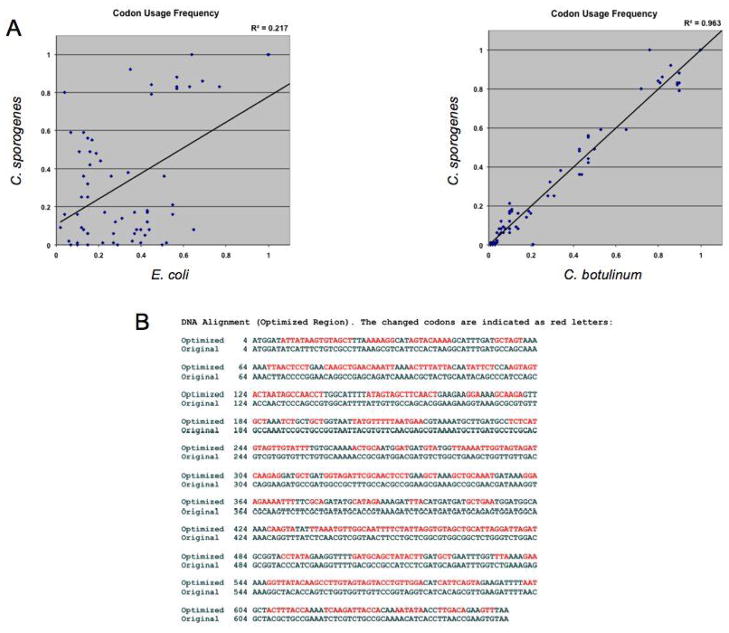
Fig. 3.
(A) Plot of codon usage frequencies between E. coli and C. sporogenes (left) and C. botulinum and C. sporogenes (right). The greater the similarity in codon usage frequency of a given codon in both strains the higher the correlation coefficient will be. Of all the genome-sequenced Clostridial species, C. botulinum possessed the highest correlation coefficient in codon usage frequency when plotting against that of C. sporogenes. (B) Alignment of nucleotides sequence of optimized NTR (sNTR) and original NTR. Nucleotides not matched to the original NTR are shown in red. Of note, there is only a 34% similarity in DNA sequence between sNTR and the original NTR.

