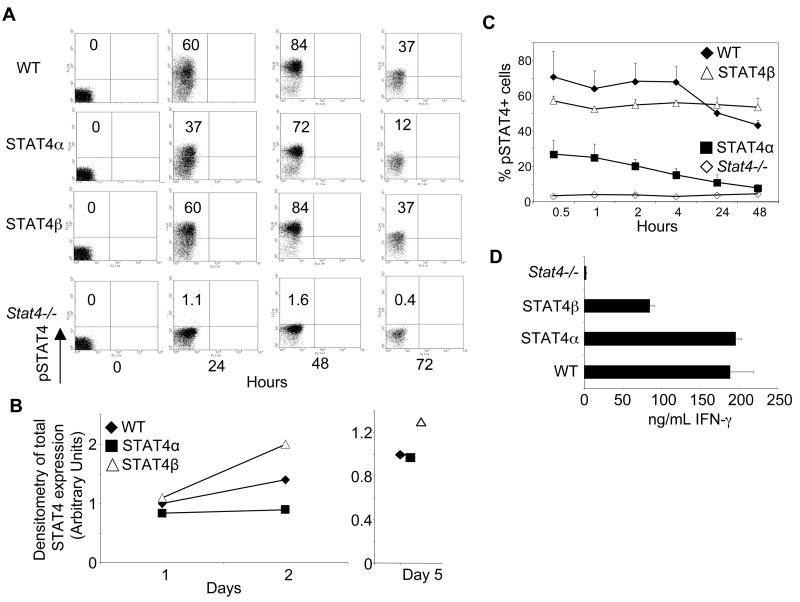
FIGURE 2.
Activation kinetics of the STAT4 isoforms during Th1 differentiation. A, Naïve CD4+ T cells freshly isolated (0 time point) or cultured in Th1 conditions for 24, 48, or 72 hours were collected for intracellular staining with anti-pStat4. Results are representative of 2 independent experiments. Numbers in quadrants represent % of pSTAT4+ T cells. B, Total cell extracts from WT and STAT4 transgenic T cells were immunoblotted for STAT4 protein levels at day 1, 2 and 5 of Th1 differentiation. Data is presented as arbitrary units of densitometry normalized to actin expression and relative to WT day 1 in the left panel or WT day 5 in the right panel. C, Th1 cells cultured for 5 days were washed and stimulated with IL-12 for the indicated time points before being intracellular stained for pSTAT4. Data are shown for the averages of duplicate samples of representative data. D, Th1 cells were stimulated with IL-12 and IL-18 for 24 hours and cell-free supernatants were analyzed for IFN-γ using ELISA. Results are shown as mean ± SD.

