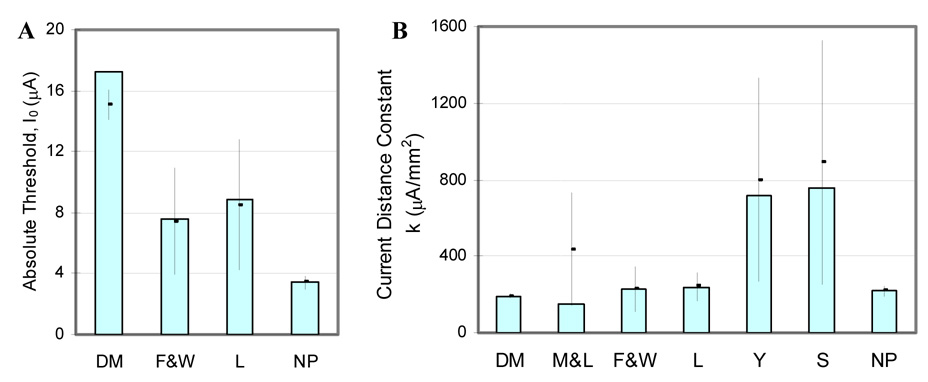
Fig. 10.
Sensitivity analysis of the current distance parameters to measurement noise or error with each of the methods. The bars show absolute threshold, I0 (A) and current distance constant, k (B) calculated from noise free measurements, and the points and error bars show the mean and standard deviation of the parameters estimated across 100 repeated measurements with random added noise. (DM: direct measurement from single cells; M&L: Milner and Laferriere (1986) method; F&W: Fouriezos and Wise (1984) method; L:Liang et al. (1991) method; Y:Yeomans et al. (1986) method; S:Snow et al. (2006) method; NP: newly proposed method).

