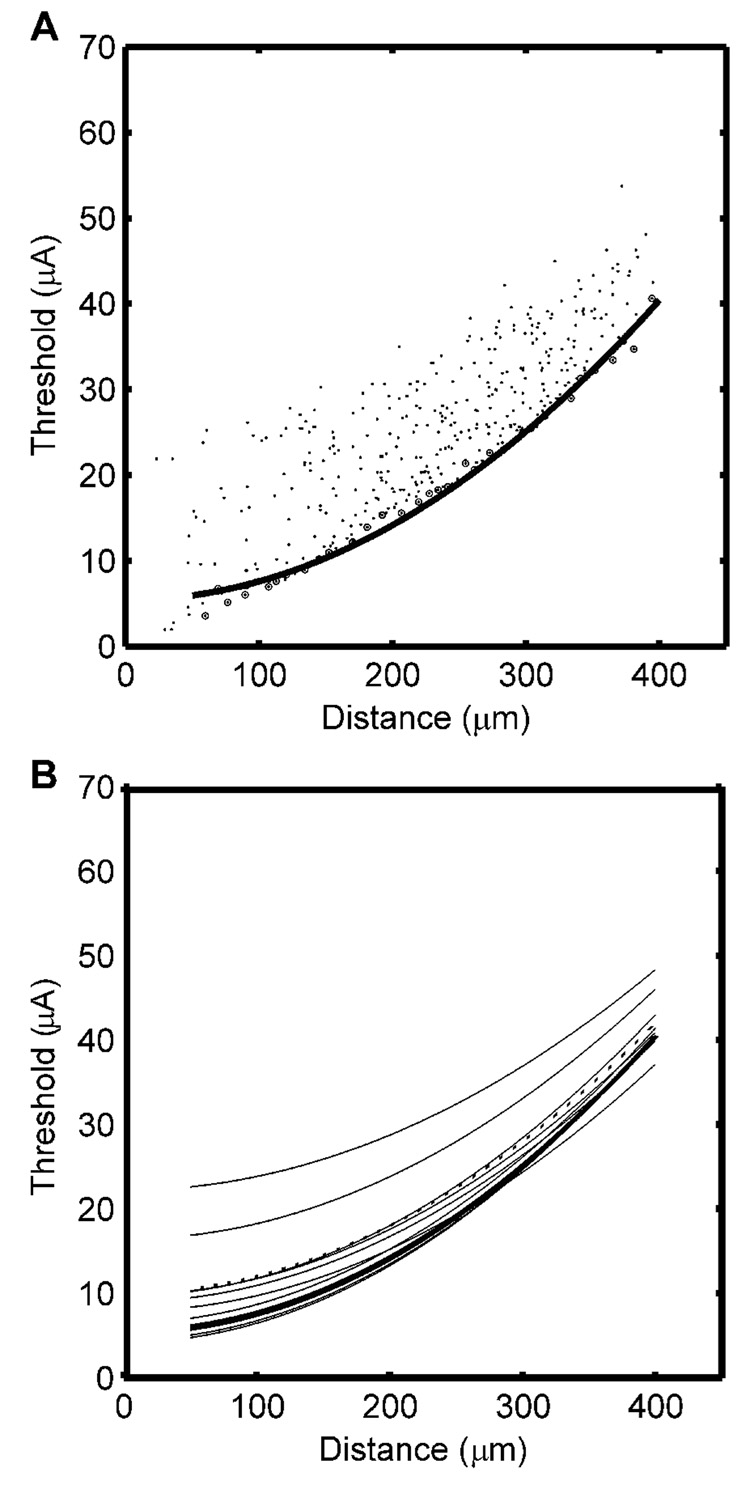
Fig. 5.
Current distance relationships (CDRs) obtained from the population model and from single nerve fibers. A. Current-distance relationships obtained by measuring individually the threshold for each fiber in the population. The circled points were used as the lower boundary of the threshold band, and the curve is the fit of the quadratic CDR to the lower boundary. B. Nine CDRs obtained by direct measurement from single nerve fibers, the average CDR across the nine fibers (dotted line), and the optimal CDR obtained from the lower boundary (bold line).

