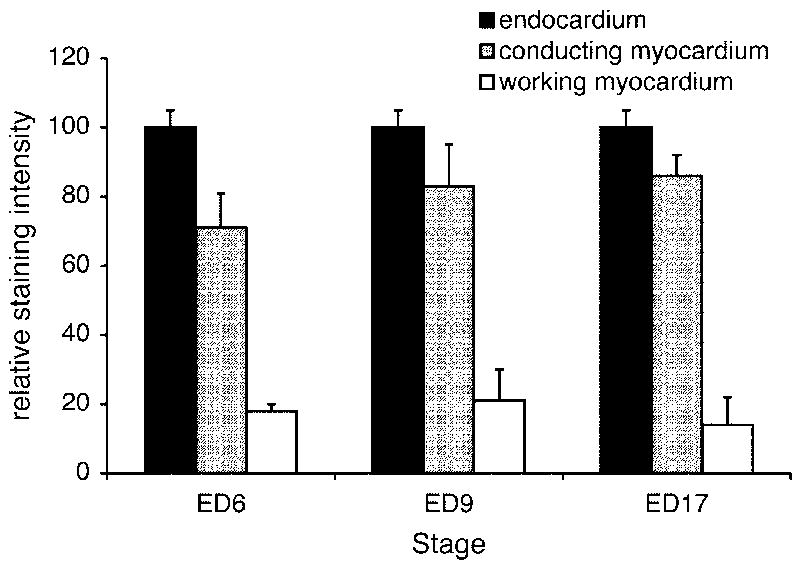
Figure 4.
Quantification of ECE staining intensity in different regions of the heart. The expression was consistently found to be the highest in the endocardium covering the atrioventricular valves, and the values in the conduction tissues exceeded those in the working myocardium. Maximum values from each compartment were used; the quantification is based on serial sections of at least 3 hearts per stage.

