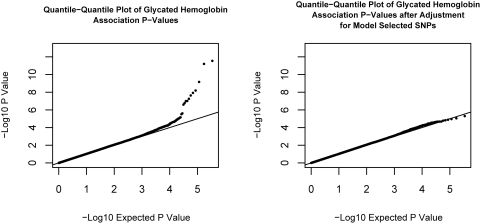
Figure 2. Quantile-Quantile plot of Glycated Hemoglobin Association P-Values.
The quantile-quantile plot of glycated hemoglobin association P-values is shown on the left. On the right, the same quantile-quantile plot is shown, but after adjusting glycated hemoglobin values for the additive genetic effect of the 5 SNPs retained by the model selection algorithm (rs1402837, rs730497, rs13266634, rs7072268 and rs2305198; see text for details).

