Abstract
Spatial excitation patterns in cochlear implant users can be measured with the electrically evoked compound action potential (ECAP). This study examined whether the relative separation of ECAP excitation patterns for two electrodes was correlated with the ability to discriminate those electrodes on the basis of pitch. Significant correlations were found for nine of the ten subjects. Electrodes with significant relative overlap of ECAP spatial excitation patterns were generally more difficult to distinguish on the basis of pitch. Pitch-ranking ability and overlap of ECAP patterns were both affected by the relative separation between electrodes in each pair. With increased separation between electrodes, pitch ranking improved significantly, and ECAP spatial excitation patterns showed significantly less overlap.
INTRODUCTION
Present cochlear implant (CI) arrays consist of 12–22 electrodes spaced along the length of the cochlea. Different pitch percepts are achieved through stimulation at different locations along the array. For CI users, the ability to discriminate electrodes on the basis of pitch is likely influenced by the spatial overlap of stimulated neural populations. Spread of excitation (SOE) patterns for CI electrodes can be measured with the electrically evoked compound action potential (ECAP) using a forward-masking paradigm (Abbas et al., 2004; Cohen et al., 2003; Eisen and Franck, 2005; Hughes and Abbas, 2006). Hughes and Abbas (2006) investigated whether electrodes with more restricted SOE patterns were more easily discriminated on the basis of pitch. Widths of SOE patterns were compared with slopes of electrode pitch-ranking functions. It was hypothesized that steeper slopes (better pitch ranking) would be correlated with narrower SOE patterns. No significant correlations were found for individual or group data. It was noted that the SOE width measure might not adequately capture other aspects of the function that may be predictive of electrode pitch ranking, such as relative location of the pattern edges or the overall spread of the function (e.g., McKay et al., 1999).
In this letter, data from the Hughes and Abbas (2006) study were re-analyzed to examine the relation between relative separation of SOE functions and electrode pitch-ranking accuracy for pairs of electrodes. There were three notable differences with the new analysis: (1) Comparisons of SOE and pitch-ranking measures were made for electrode pairs, whereas the initial study used single electrodes; (2) The entire SOE function was used to measure overlap, whereas the initial study used only the width at 75% of the normalized amplitude; (3) Pitch-ranking percent correct was used instead of the slope of the psychometric function. It was hypothesized that electrodes with greater overlap of SOE patterns would be more difficult to distinguish on the basis of pitch.
METHODS
Data from the ten adult CI users from Hughes and Abbas (2006) were re-evaluated (N=5 Nucleus 24M, N=5 Nucleus 24R[CS]). Mean age at implant was 59 years (range: 35–72), mean duration of CI use was 2.6 years (range: 5 months–5 years), and mean duration of deafness prior to implantation was 9.1 years (range: 2 months–48 years). For additional subject demographics, see Table I of Hughes and Abbas (2006).
Behavioral threshold and maximum comfort levels were determined using clinical programming procedures and software (WinDPS, R116, build 445) via a SPrint speech processor and processor control interface (PCI). The stimulus was a 250-pps, 500-ms pulse train of 25-μs∕phase biphasic current pulses presented in monopolar mode (re: MP1). Stimuli were loudness balanced across electrodes at 50% and 100% of the dynamic range. Subjects reported all electrodes to be in tonotopic order based on subjective pitch of stimuli swept across the array. Stimulation levels were determined from these behavioral dynamic ranges, as described below.
ECAPs were obtained using the Neural Response Telemetry software (v. 3.0) via a SPrint speech processor and commercial interface (PCI or portable programming system). Default stimulus and recording parameters were used: 80 Hz rate, 25 μs∕phase pulse width, 60 dB gain, MP1 stimulus reference electrode, and MP2 recording reference electrode. A forward-masking paradigm was used to measure spatial excitation patterns and to separate the ECAP response from stimulus artifact [see Hughes and Abbas (2006) for further details]. Briefly, the probe pulse was fixed on one electrode and the location of the masker was varied across the array. The resulting ECAP amplitude represents the overlap between masker and probe, where the largest amplitude should occur when masker and probe are delivered to the same electrode, with progressively smaller amplitudes for greater separations between masker and probe. Current levels were fixed at 80% of the behavioral dynamic range for each electrode, except for M24 and M50, who required levels at 90% for measurable ECAPs. ECAP recordings were an average of 50–200 sweeps, recorded 2–3 electrode positions apical to the probe electrode. ECAP amplitudes were measured as the difference between the leading negative peak (N1) and the following positive peak or plateau (P2).
For the re-analysis, ECAP SOE functions were normalized to the single highest amplitude of all ECAPs within each subject to allow comparisons within and across subjects. In Hughes and Abbas (2006), SOE functions were normalized separately for each probe electrode. The present approach preserved the relative amplitude differences across functions within each subject to allow comparisons of different pairs of electrodes.
For each electrode pair that was tested for pitch ranking, the respective SOE functions were compared and quantified. The amount of separation between the two SOE functions, henceforth termed ECAP separation index, was calculated as the absolute value of the difference in normalized amplitude, summed across all masker electrodes
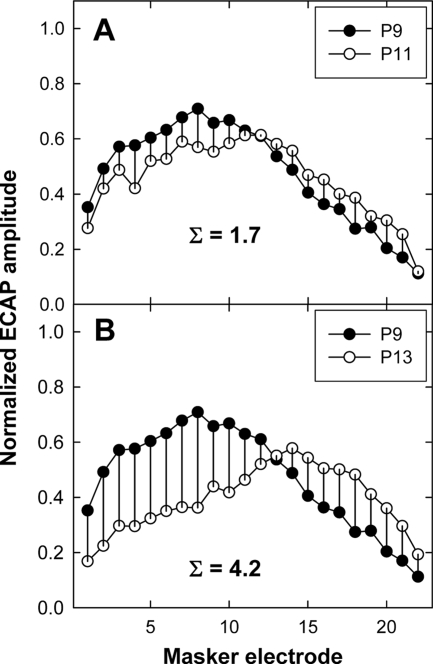
where ax and ay represent the normalized amplitudes of the two ECAP functions for probe electrodes x and y at each masker electrode i. Two examples illustrating this method are shown in Fig. 1 for M35b. In Fig. 1a, ECAP SOE functions for probe electrode 9 (P9) and P11 are shown; Fig. 1b shows SOE functions for P9 and P13. The peak of each function typically occurs at the probe electrode. Therefore, relative to the point where the functions cross, amplitudes are higher for the more basal probe (P9) on the basal side and for the more apical probe (P11 or P13) on the apical side. Vertical lines connecting the symbols represent the amplitude difference at each masker electrode. The ECAP separation index was 1.7 for P9 versus P11 and 4.2 for P9 versus P13. Thus, a larger ECAP separation index indicates greater separation between SOE functions.
Figure 1.
Comparison of normalized ECAP SOE patterns for probe electrode P9 vs P11 (panel A) and P9 vs P13 (panel B) for subject M35b. Vertical bars indicate the difference in normalized amplitude at each masker electrode. Sigma values in each panel represent the sum of the differences in normalized amplitude across all masker electrodes.
The stimulus for pitch ranking was the same as that used to determine behavioral dynamic range. Pitch ranking was evaluated using a two-interval (separated by 500 ms), two-alternative, forced-choice procedure in which the subject indicated whether the second sound was higher or lower in pitch relative to the first. Stimulus levels were jittered between 70%, 80%, and 90% of the behavioral dynamic range to reduce the effects of loudness cues1. For the present analysis, the existing data set was examined to identify pairs of electrodes in which each electrode occurred in the first and second interval an equal number of times2. This resulted in as few as three electrode pairs (subject R13) to as many as 39 pairs (M24) across subjects. A total of 36 comparisons were obtained for each electrode pair: nine comparisons per block (three levels for each electrode), two blocks, and two conditions (each electrode in the first and second interval). Percent correct was calculated as the number of times (out of 36) that the more basal electrode in the pair was judged as higher in pitch. Percent-correct scores were converted to z scores so that linear regression analysis could be used to compare the ECAP separation index to pitch ranking.
RESULTS AND DISCUSSION
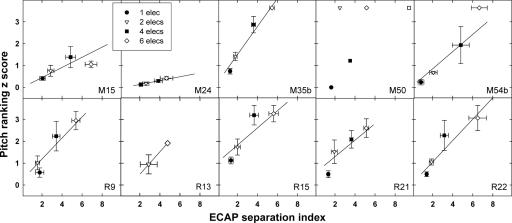
Table 1 lists the correlation coefficients and p values for the comparison between pitch-ranking z score and ECAP separation index for all electrode pairs per subject. Significant positive correlations were obtained for nine of the ten subjects (exception: M50). Correlation coefficients ranged from 0.52 (p=0.02) to 1.0 (p=0.002)3. In contrast to the original study, these results suggest that the amount of separation between ECAP SOE functions is well correlated with electrode pitch-ranking accuracy.
Table 1.
Correlation coefficients (r value) and significance (p value) for pitch-ranking z score vs ECAP separation index for all electrodes within each subject. Number of electrode pairs tested for electrode separations of 1, 2, 4, 5, and 6 for each subject.
| Subject | r | p | No. pairs at electrode separation of | ||||
|---|---|---|---|---|---|---|---|
| 1 | 2 | 4 | 5 | 6 | |||
| M15 | 0.60 | 0.001 | 8 | 8 | 6 | ⋯ | 4 |
| M24 | 0.55 | <0.001 | 12 | 11 | 9 | ⋯ | 7 |
| M35b | 0.81 | <0.001 | 9 | 8 | 8 | ⋯ | 5 |
| M50 | 0.59 | 0.29 | 1 | 1 | 1 | 1 | 1 |
| M54b | 0.68 | 0.005 | 3 | 7 | 3 | ⋯ | 2 |
| R9 | 0.60 | 0.002 | 6 | 6 | 6 | ⋯ | 5 |
| R13 | 1.00 | 0.002 | ⋯ | 2 | ⋯ | ⋯ | 1 |
| R15 | 0.58 | 0.001 | 8 | 9 | 6 | ⋯ | 6 |
| R21 | 0.52 | 0.02 | 5 | 5 | 5 | ⋯ | 5 |
| R22 | 0.81 | <0.001 | 6 | 5 | 3 | ⋯ | 3 |
Figure 2 shows pitch-ranking z score versus ECAP separation index plotted with the electrode-pair spacing as the parameter. Bidirectional error bars represent 1 standard error around the mean (±1 SEM). Different symbols represent different electrode separations, where a spacing of one is adjacent. All but two subjects (R13 and M50) had data for electrode separations of 1, 2, 4, and 6 electrodes. Table 1 lists the number of electrode pairs at each separation for individual subjects in Fig. 2. M50, M15, and R9 demonstrated nonmonotonic functions; however, the difference in z scores for electrode separations of 4 versus 6 for M15 and the difference in ECAP separation indices for separations of 1 versus 2 for R9 were not statistically significant (t test, p>0.6). In general, most subjects showed relatively linear functions, with larger z scores and larger ECAP separation indices for greater electrode separations.
Figure 2.
Data for individual subjects showing mean (±1 SEM) z score as a function of mean (±1 SEM) ECAP separation index for all electrode pairs that were separated by 1, 2, 4, and 6 electrodes (separation of 5 electrodes for M50 is indicated by an open square). Solid lines represent linear regression analyses.
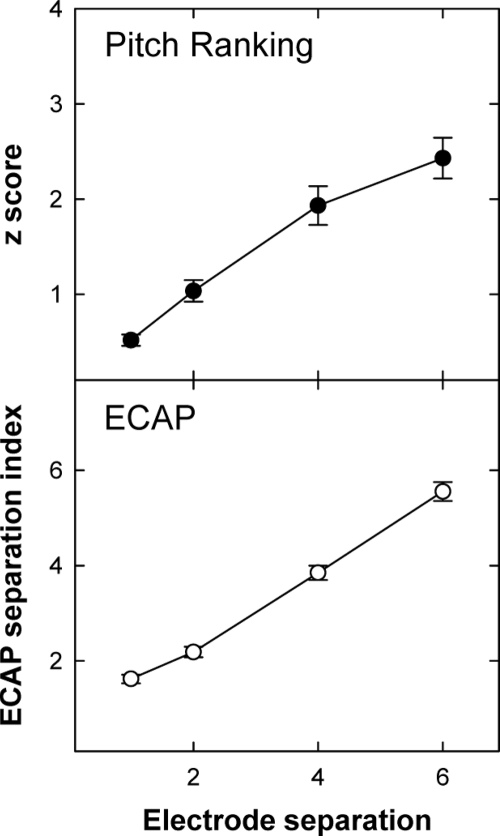
Figure 3 shows average z scores (top) and ECAP separation indices (bottom) across all subjects for electrode separations of 1, 2, 4, and 6. There was a statistically significant correlation between mean z score and ECAP separation index as a function of electrode separation (r=0.98, p=0.019). Mean z scores and ECAP separation indices were significantly different across all electrode separations (p<0.001, one-way repeated-measures analysis of variance). In summary, pitch ranking improved significantly and ECAP spatial excitation patterns demonstrated significantly less overlap for increased spatial separation between electrode pairs.
Figure 3.
Mean (±1 SEM) z scores (top panel) and mean (±1 SEM) ECAP separation indices (bottom panel) across all electrode pairs and subjects, plotted as a function of electrode separation.
CONCLUSIONS
In contrast to the original study (Hughes and Abbas, 2006), a significant positive correlation between ECAP spatial excitation and electrode pitch ranking was found for nine of the ten subjects. In Hughes and Abbas (2006), pitch ranking was quantified as the slope of the psychometric function, in which the pitch of a fixed reference electrode was compared with the pitch of various other electrodes at progressively greater electrode separations. Therefore, the pitch-ranking measures reflected effects of electrode separation. In contrast, ECAP measures in that study were quantified as the width of the ECAP spatial excitation function at 75% of the normalized amplitude. The primary limitation of quantifying the ECAP data in this way is that the shape of the function at greater electrode separations is not characterized. For example, two ECAP functions may have similar widths at the 75% point, but they may have very different shapes overall [see Fig. 7 from Hughes and Abbas (2006)]. The present method takes into account the relative location of the edges of each ECAP pattern and the overall spread of each function. As a result, less overlap of ECAP spatial excitation patterns was found to be strongly correlated with greater accuracy of electrode pitch ranking. Future studies will evaluate whether the present methodology is sensitive enough to use ECAP SOE measures to predict pitch ranking with intermediate or virtual channels.
ACKNOWLEDGMENTS
Original data collection supported by the NIH, NIDCD, P50 DC00242; and NIH, NCRR, RR00059 (University of Iowa). New data analysis was supported by the NIH, NIDCD, R03 007017 (Boys Town National Research Hospital). Paul Abbas, Donna Neff, Walt Jesteadt, and two anonymous reviewers provided helpful editorial comments.
Footnotes
Exception: M24 and M50, whose ECAP measures were made at 90% of the behavioral dynamic range. Psychophysical levels for those two subjects were 80%, 90%, and 100% of the dynamic range.
In the psychophysical portion of the original study, each test electrode always occurred first within a block. Test electrodes were not necessarily always used as reference electrodes (i.e., second in a block).
Because the regression line for R13 is based on only three data points, it yields little information about the goodness of fit. However, the slope of the line serves as a comparison to that of the other subjects.
References
- Abbas, P. J., Hughes, M. L., Brown, C. J., Miller, C. A., and South, H. (2004). “Channel interaction in cochlear implant users evaluated using the electrically evoked compound action potential,” Audiol. Neuro-Otol. 10.1159/000078390 9, 203–213. [DOI] [PubMed] [Google Scholar]
- Cohen, L. T., Richardson, L. M., Saunders, E., and Cowan, R. S. C. (2003). “Spatial spread of neural excitation in cochlear implant recipients: Comparison of improved ECAP method and psychophysical forward masking,” Hear. Res. 10.1016/S0378-5955(03)00096-0 179, 72–87. [DOI] [PubMed] [Google Scholar]
- Eisen, M. D., and Franck, K. H. (2005). “Electrode interaction in pediatric cochlear implant subjects,” J. Assoc. Res. Otolaryngol. 6, 160–170. [DOI] [PMC free article] [PubMed] [Google Scholar]
- Hughes, M. L., and Abbas, P. J. (2006). “The relation between electrophysiologic channel interaction and electrode pitch ranking in cochlear implant recipients,” J. Acoust. Soc. Am. 10.1121/1.2163273 119, 1527–1537. [DOI] [PubMed] [Google Scholar]
- McKay, C. M., O’Brien, A., and James, C. J. (1999). “Effect of current level on electrode discrimination in electrical stimulation,” Hear. Res. 126, 159–164. [DOI] [PubMed] [Google Scholar]


