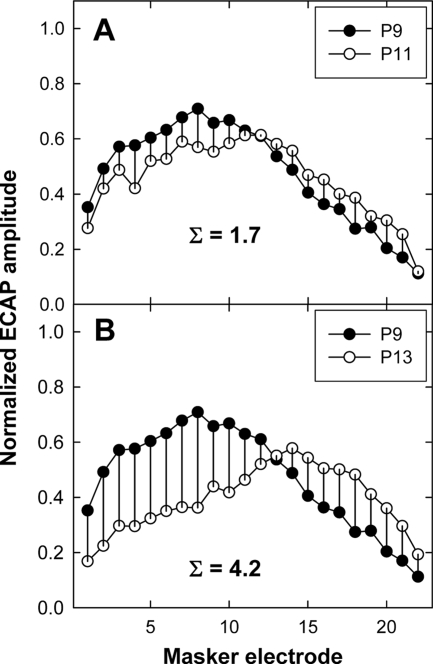
Figure 1.
Comparison of normalized ECAP SOE patterns for probe electrode P9 vs P11 (panel A) and P9 vs P13 (panel B) for subject M35b. Vertical bars indicate the difference in normalized amplitude at each masker electrode. Sigma values in each panel represent the sum of the differences in normalized amplitude across all masker electrodes.

