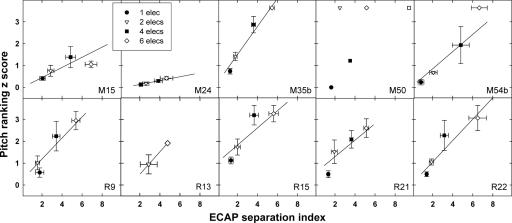
Figure 2.
Data for individual subjects showing mean (±1 SEM) z score as a function of mean (±1 SEM) ECAP separation index for all electrode pairs that were separated by 1, 2, 4, and 6 electrodes (separation of 5 electrodes for M50 is indicated by an open square). Solid lines represent linear regression analyses.

