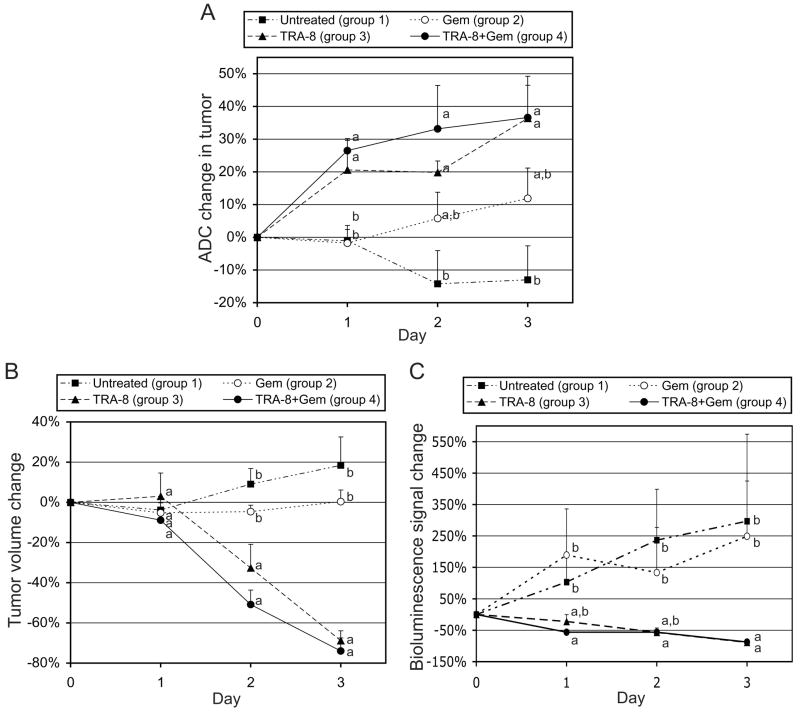
Figure 4.
Analyses of tumor response to treatment. (A) Intratumoral apparent diffusion coefficient (ADC) change, (B) tumor volume change, and (C) bioluminescence signal change, measured at 1, 2, and 3 days after initiation of therapy, when groups 1–4 were untreated and treated with gemcitabine (120 mg/kg), TRA-8 (200 μg), and combined therapy respectively on day 0. Statistical differences among groups are indicated by different letters on each day.

