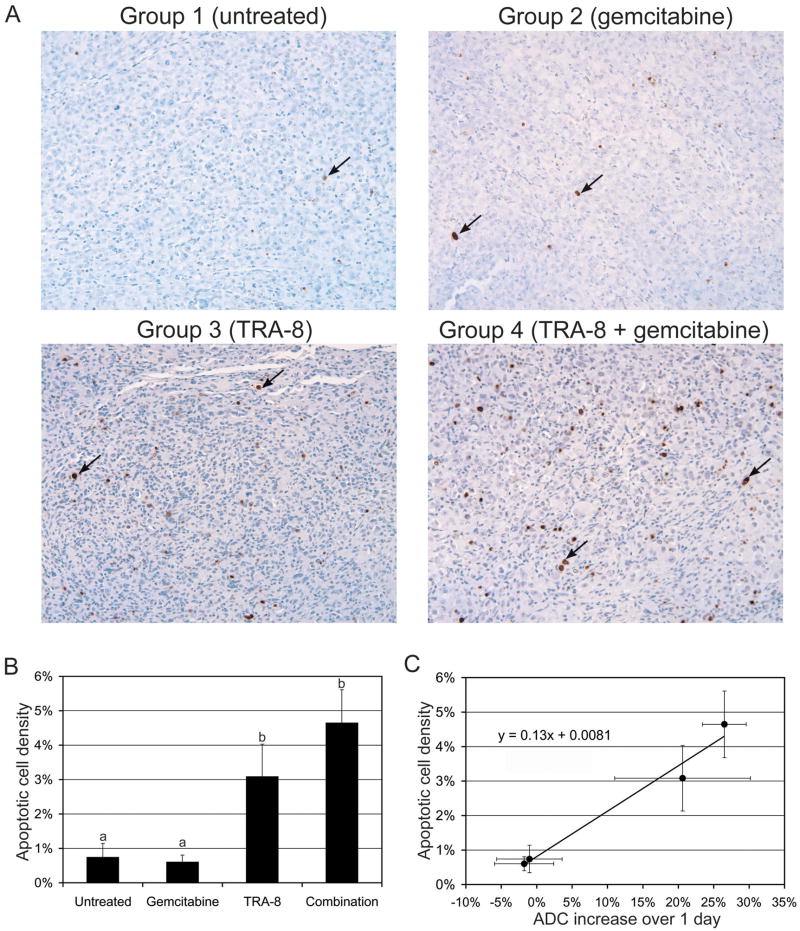
Figure 5.
Histologic analyses of tumor response. (A) Representative TUNEL (X250) staining of MIA PaCa-2 tumors collected at day 3, when saline (untreated), gemcitabine, TRA-8, and TRA-8 combined with gemcitabine were administrated respectively on day 0. An apoptotic cell is indicated with a black arrow in each sub-figure. (B) Apoptotic cell densities are presented at the four different treatments, while different letters above bars indicate statistical differences among groups. (C) Apoptotic cell density (shown in Fig. 5B) versus ADC increase over 1 day (shown in Fig. 4A).

