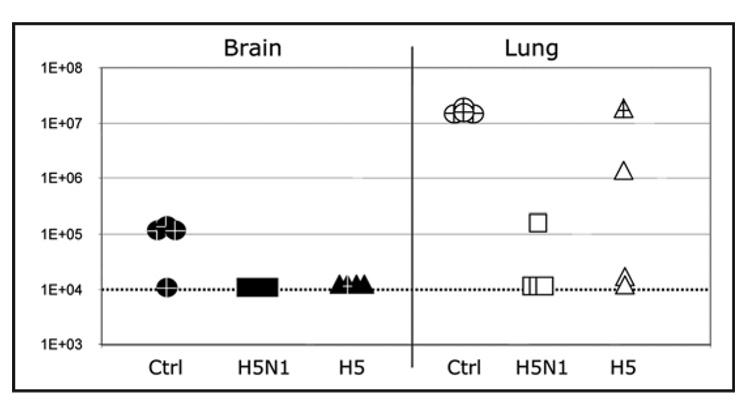
Figure 9.
H5N1 virus level in the brain and lungs of synDNA™ vaccinated and virus challenged mice. In trial 2, mice were vaccinated via intramuscular (i.m.) route with the indicated synDNA™ (50 µg per mouse) or, as controls, with saline or control synDNA™, on day -42, -28 and -14 and challenged with a lethal dose of influenza A/H5N1 virus on day 0, as described in Figure 3B. At 5 days post-challenge, five mice per vaccination group were euthanized and organs collected for viral titration. Viral titer in brain (solid) and lung (open) tissues for individual mice in each H5N1 (square), H5 (triangle) and control (circle) synDNA™ immunized group are shown. Y axis represents H5N1 TCID50 per g of given tissue. Marked points (+) refer to mice that already presented signs of morbidity at day 5 post-challenge. The dotted line at TCID50 = 1E + 04 represents the limit of detection for our assay.

