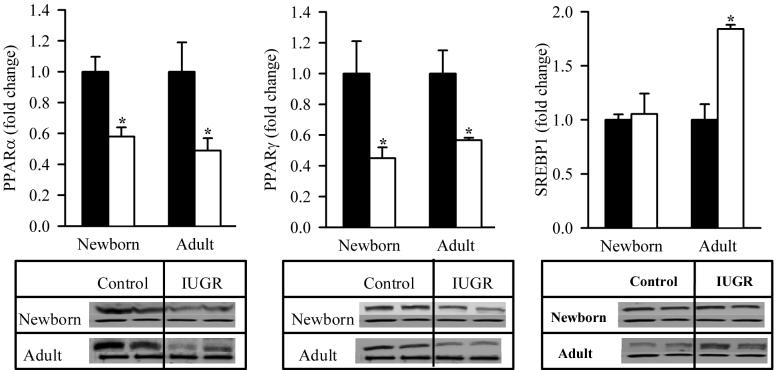
Figure 1. Protein Expression of Hepatic Transcription Factors.
Hepatic protein expression of PPARα, PPARγ and SREBP1 (upper band) in male offspring from Control (■) and IUGR (□) groups. Data was normalized to β-actin and presented as fold difference. β-actin (lower band) was comparable between IUGR and Control offspring at both ages. The number of animals studied per group per age was 4 males from 4 litters. *P <0.01 vs. Control offspring.

