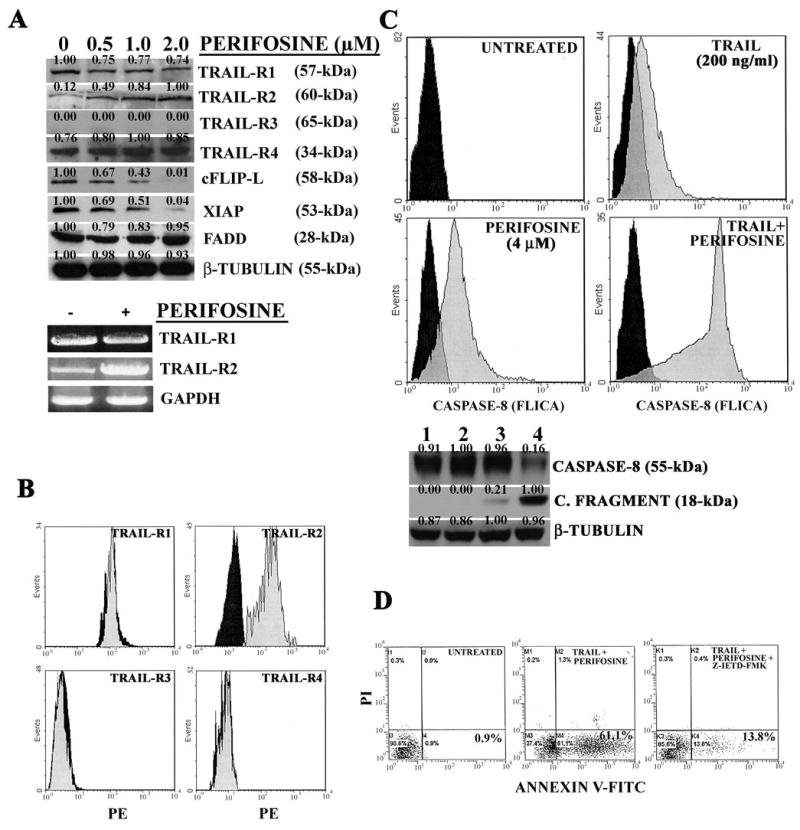
Figure 2. Perifosine decreases cFLIP-L and XIAP expression, and downregulates TRAIL-R2 expression in THP-1 cells.

A: western blot and RT-PCR analysis performed on THP-1 cells treated for 16 hr with perifosine. In case of RT-PCR analysis for TRAIL-R1 and –R2 mRNA, perifosine concentration was 0.5 μM for 16 hr. GAPDH served as a control. B: flow cytometric analysis demonstrating surface expression of TRAIL receptors in untreated cells (black shaded histograms) and cells treated with 2.0 μM perifosine (grey shaded histograms) for 16 hr. C: FLICA and western blot analysis of THP-1 cells treated with either perifosine or TRAIL alone and with two drugs together for 24 hr. For FLICA analysis: black shaded histograms correspond to untreated cells, while grey shaded histograms represent drug-treated cells. For western blot analysis: Lane 1: untreated cells; Lane 2: TRAIL-treated cells; Lane 3: perifosine-treated cells; lane 4: TRAIL and perifosine treated cells. For western blot analysis, TRAIL and perifosine concentrations were as for FLICA analysis. Drug treatment was for 24 hr. D: Annexin V-FITC/PI staining analysis of THP-1 cells treated with the two drugs together for 24 hr. Samples had been pre-treated for 1 hr with the caspase-8 inhibitor, Z-IETD-FMK (20 μM). Drug concentrations were as in Panel C. The numbers in the lower right quadrants correspond to the percentage of cells which are Annexin V-positive and PI-negative (early apoptotic cells).
