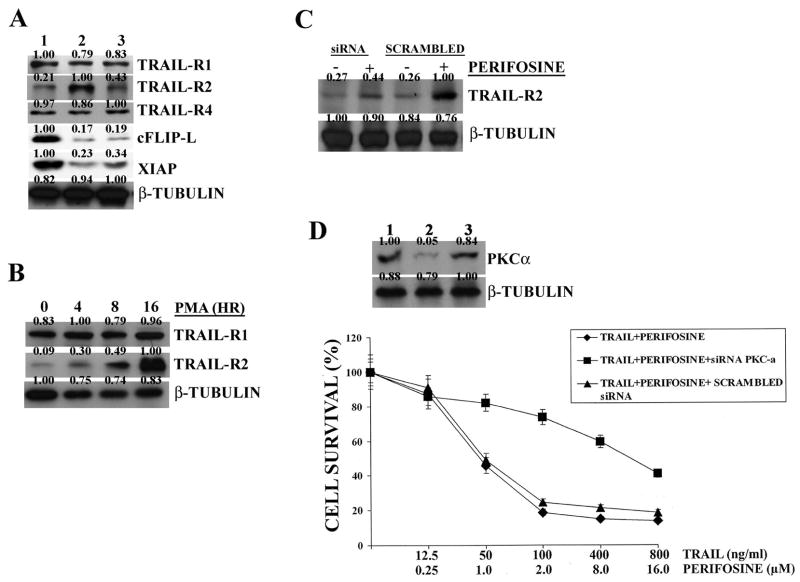
Figure 3. Increased TRAIL-R2 expression in THP-1 cells is dependent on PKCα.
A: western blot analysis of THP-1 cell extracts. Lane 1: untreated cells; Lane 2: cells treated with perifosine (2 μM); Lane 3: cells treated with perifosine (2 μM) + Gö6976 (0.5 μM). Treatments were for 16 hr. B: western blot analysis for TRAIL-R1 and -R2 expression in THP-1 cells treated with PMA (100 ng/mL) for increasing periods of time. C: western blot analysis for TRAIL-R2 expression levels in cells incubated with perifosine (2 μM for 16 h). Cells treated for 48 hr with PKCα specific siRNA or scrambled siRNA. D: results from MTT assays in cells treated with TRAIL and perifosine for 24 hr at the indicated concentrations. The western blot analysis for PKCα levels in THP-1 cell extracts is also shown. Lane 1: untreated cells; Lane 2: cells treated with siRNA specific for PKCα; Lane 3: cells treated with scrambled siRNA. Cells were analyzed 48 hr after transfection. β-tubulin served as loading control.

