
Fig.4.
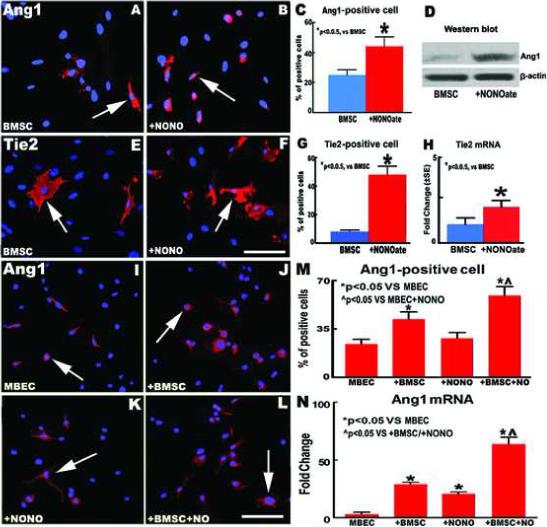
DETA-NONOate alone or combination with the conditioned medium from BMSCs Increase Ang1 gene and protein expression in BMSCs and MBECs. (A-C) Ang1 expression in the non-treatment control (A) and DETA-NONOate (0.4 μM) treatment (B) groups in BMSCs at 24 hours after treatment. (D) Ang1 protein measured by western blot at 24 hours after treatment. (E-G) Tie2 expression in non-treatment control (E) and DETA-NONOate treatment (F) groups in BMSCs at 24 hours after treatment. (H) Tie2 mRNA measured by real time polymerase chain reaction (PCR) at 3 hours after treatment. (I-M) Ang1 expression in non-treatment control (I), BMSC conditioned medium alone (J), DETA-NONOate alone (K), and combination DETA-NONOate with BMSC conditioned medium (L) in mouse brain endothelial cells (MBECs) at 24 hours after treatment. (N) Ang1 mRNA in MBECs measured by real time PCR at 3 hours after treatment. Scale bar = 25 μm. n = 6 / group in (A-C), (E-G), (I-M) and n = 3 / group in (D), (H), (N).