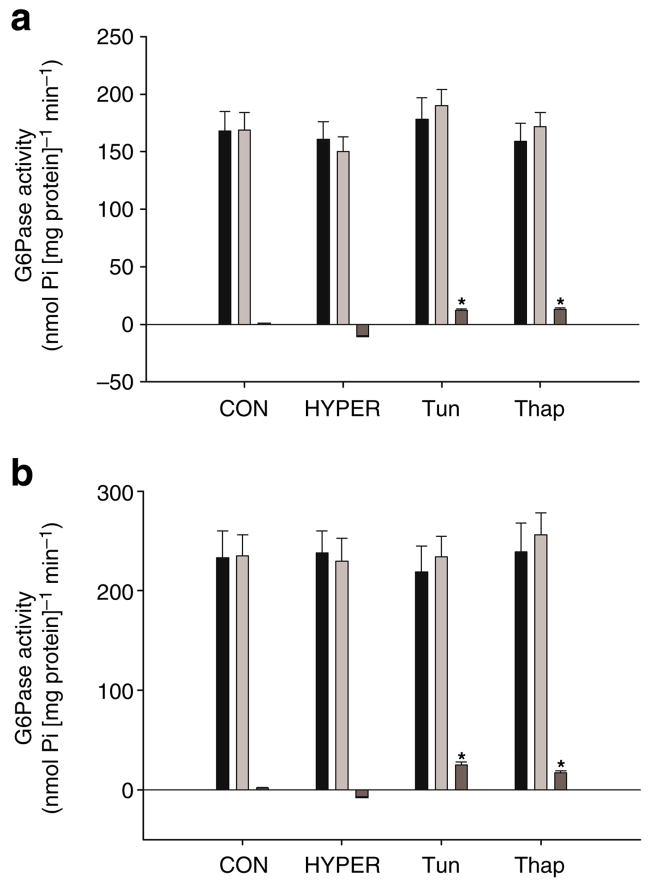
Fig. 6.
G6Pase activity in whole liver homogenates (a) and intact liver microsomes (b) prior to (Pre, black bars) and following (Post, light grey bars) the intraportal infusions in the CON, HYPER, Tun and Thap groups of anaesthetised rats. Change (dark grey bars) represents the difference between post and pre samples. Data are reported as the mean±SD for n=5–10 per group. *p<0.05 vs CON and HYPER. Pi, inorganic phosphate

