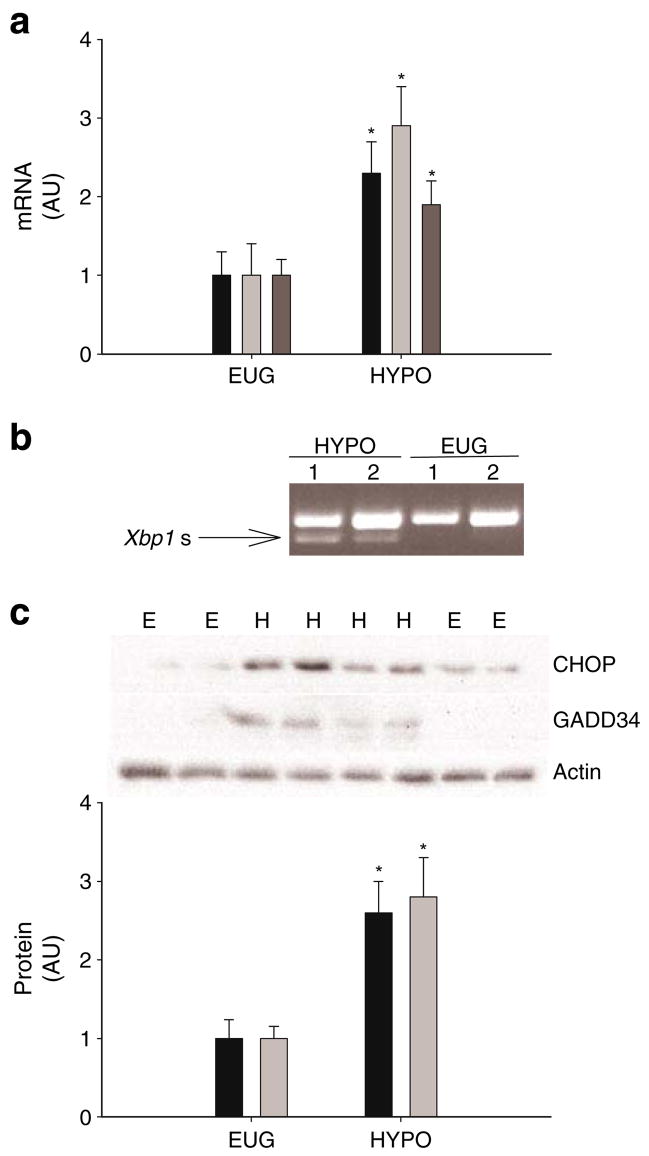
Fig. 8.
UPR markers. a Levels of Chop (black bars), Gadd34 (light grey bars) and Tmem132a (dark grey bars) mRNAs in liver samples taken following the clamps in the EUG (or E) and HYPO (or H) groups of conscious rats. b Representative gel of spliced Xbp1 mRNA (Xbp1 s) in liver samples taken following clamps. Xbp1 s was observed in five of six rats in the HYPO group and none of six rats in the EUG group. c CHOP and GADD34 in liver samples taken following clamps. The representative gel shows CHOP, GADD34 and actin (loading control). Data in the graph are reported as the mean±SD for n=6 per group. *p<0.05 vs EUG. AU, arbitrary units

