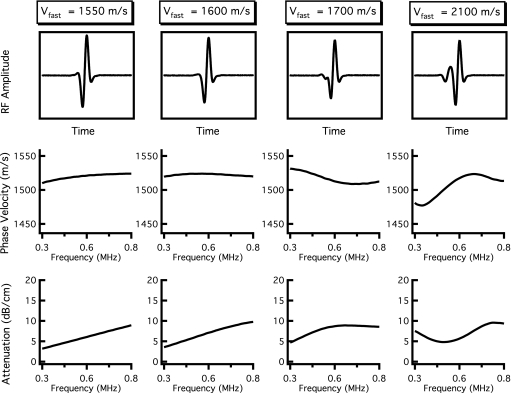
Figure 3.
Results of independent fast and slow wave propagations when the velocity of the fast wave is varied. The velocity of the fast wave increases from the left column to the right column. The top panels display the resultant mixed rf wave forms, and the center and bottom panels show the corresponding dispersion curves and attenuation coefficients obtained when the mixed wave form is analyzed as if it contained only one wave. When vfast is only 50 m∕s greater than vslow (far left panels), the mixed wave form exhibits positive dispersion and a nearly linear attenuation coefficient. As vfast becomes increasingly greater than vslow (middle panels), the dispersion becomes negative. When vfast is significantly larger than vslow (far right panels), the dispersion curve and attenuation coefficient have complicated frequency-dependent behavior.

