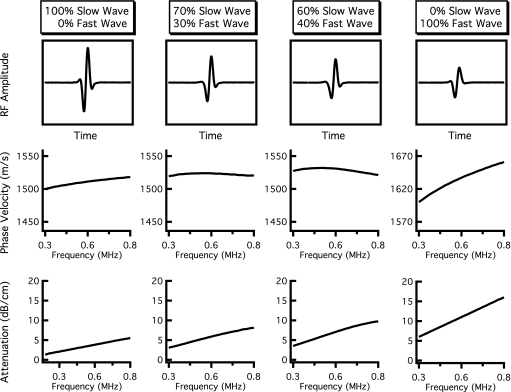
Figure 4.
Results of independent fast and slow wave propagations when the relative contributions of the fast and slow waves are varied. The contribution of the fast wave increases from the left column to the right column. The top panels display the resultant mixed rf wave forms, and the center and bottom panels show the corresponding dispersion curves and attenuation coefficients obtained when the mixed wave form is analyzed as if it contained only one wave. The far left-hand panels display only slow wave propagation (Afast=0, Aslow=1), resulting in a positive dispersion and a strictly linear attenuation coefficient. The far right-hand panels show only fast wave propagation (Afast=1, Aslow=0), again corresponding to a positive dispersion and linear attenuation coefficient. The middle panels represent mixed wave forms (nonzero amplitudes for both fast and slow waves) that exhibit negative dispersions while maintaining an approximately linear attenuation coefficient.

