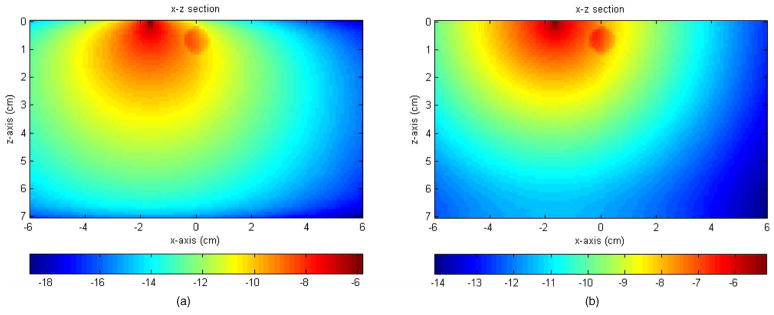
Fig. 2.
Logarithmic scale display of absorption distributions inside the medium computed using an absorption boundary (a) and a reflection boundary (b). The medium has dimensions of 12×12×7 cm3. The figure was displayed as x-z projection; x axis is the lateral dimension and z is the depth. The medium background optical properties were μa = 0.03−1 and ; the target optical properties were μa =0.3 cm−1 and . The target was a 0.5-cm radius sphere located at (0, 0, 0.7 cm), and the source was located at (−1.7 cm, 0, 0).

