
Figure 2.
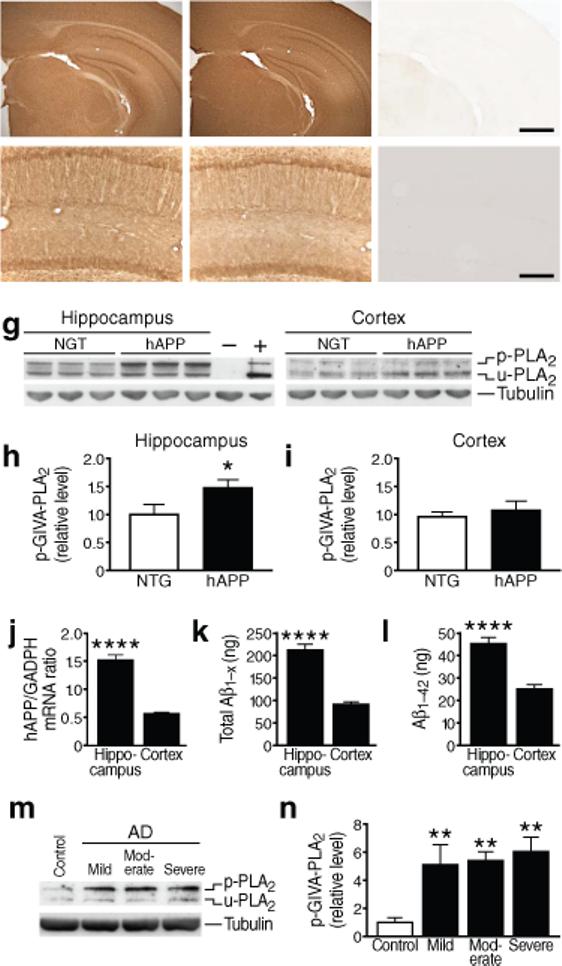
GIVA-PLA2 levels in hAPP mice and humans with AD. (a–f) Coronal sections of cortex and hippocampus (a–c) or hippocampus (d–f) in 6-month-old NTG (a,d), hAPP (b,e), and GIVA-PLA2-deficient (c,f) mice. Scale bar (a–c) 1 mm, (d–f) 250 μm. g–i, Hippocampal and cortical levels of GIVA-PLA2 in mice were determined by western blot analysis with a rabbit polyclonal antibody. g, Representative western blot showing levels of phosphorylated (p) and unphosphorylated (u) GIVA-PLA2. Tubulin served as a loading control, NIH3T3 cells as a positive control (+), and cortex from GIVA-PLA2-deficient mice as a negative control (−). h,i, Hippocampal (h) and cortical (i) GIVA-PLA2 levels determined by densitometric analysis of western blot signals (n=12 mice per genotype and brain region; age: 6 months). j, hAPP mRNA levels in hippocampus and cortex of hAPP mice determined by quantitative RT-PCR (n=7 mice; age: 2−4 months). k, l, Levels of Aβ1-x (k) and Aβ1−42 (l) (ng per g of tissue) in hippocampus and cortex of hAPP mice determined by ELISA (n=8 mice; age, 2−4 months). m–n, Levels of phosphorylated GIVA-PLA2 protein in the CA1 hippocampal region in patients with mild, moderate, or severe AD and in nondemented, age-matched controls (C) were determined by western blot analysis. m, Representative western blot. n, Western blot signals were quantitated densitometrically and normalized to tubulin (n=4−8 cases per group). *P<0.05, ****P<0.0001 (t test; mean ± s.e.m.), **P<0.01 vs. control (Tukey test; mean ± s.e.m.).