
Fig. 4.
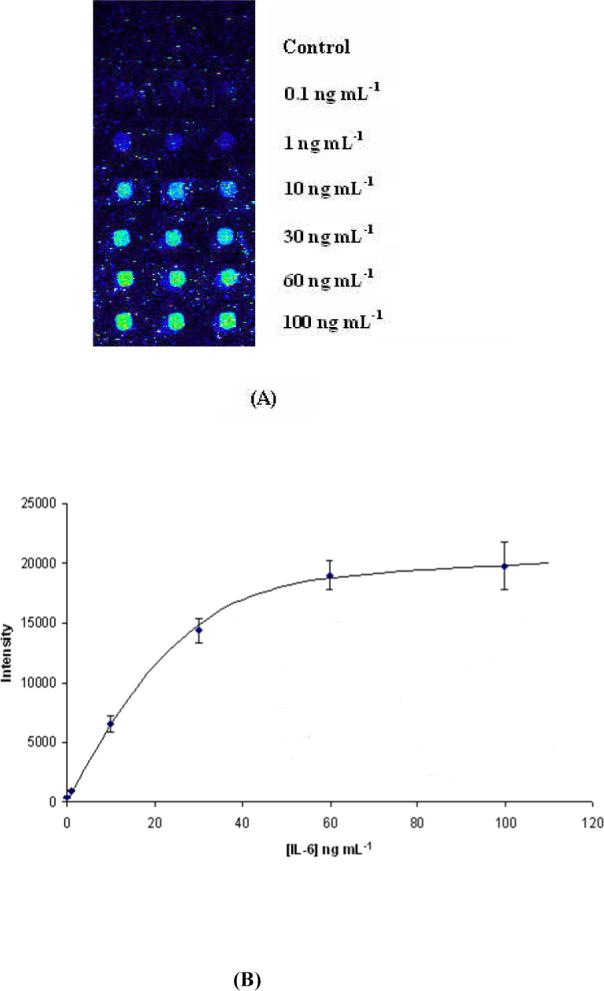
(A) Fluorescence images of protein microarray with different concentrations of antigen, IL-6 (control, 0.1, 1, 10, 30, 60, 100 ng mL−1). (B) Calibration curve of fluorescence intensity versus IL-6 concentration.
Official websites use .gov
A
.gov website belongs to an official
government organization in the United States.
Secure .gov websites use HTTPS
A lock (
) or https:// means you've safely
connected to the .gov website. Share sensitive
information only on official, secure websites.
(A) Fluorescence images of protein microarray with different concentrations of antigen, IL-6 (control, 0.1, 1, 10, 30, 60, 100 ng mL−1). (B) Calibration curve of fluorescence intensity versus IL-6 concentration.