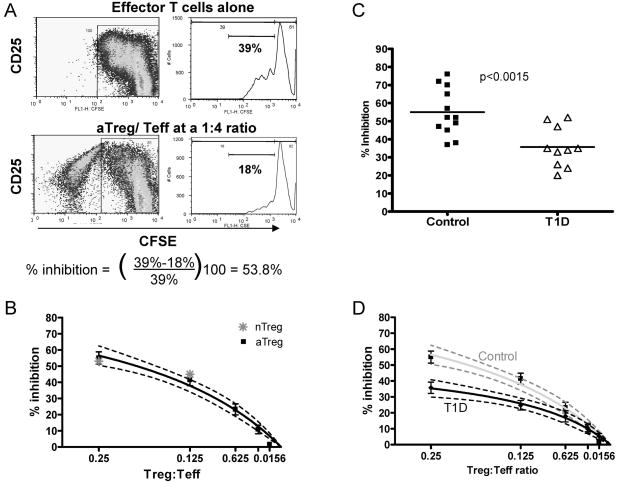
Figure 1.
Adaptive Treg suppression is impaired in subjects with T1D. A) CSFE based analysis of suppression: FACS plots represent proliferating CFSE-labeled Teff cells when cultured alone and activated with anti-CD3/anti-CD28 coated beads or co-incubated with Treg. Histograms show the % of proliferating Teff cells cultured alone or after gating out the Treg population. The % of inhibition was determined by comparing the % of proliferating Teff cells cultured alone to the % of proliferating Teff cells in co-culture. B) Suppression assays using aTreg of control subjects and either autologous or allogeneic Teff from controls show a consistent level of suppression.( ■ mean of data from all assays, best fit curve by nonlinear regression with 95% confidence intervals shown) (n=12). Suppression when nTreg are used (
 ) Representative of n=4. C) Comparison of % inhibition at a ratio of 1:4 aTreg:Teff for control subjects (■) as compared to T1D subjects (△) (n=10) (p= 0.0015). D) % Suppression displayed over a range of aTreg: Teff ratios demonstrates diminished suppression among T1D subjects, data is presented as mean of all assays (◆) and as a curve representing non-linear regression and the 95% confidence interval (black line n=10). This is shown in comparison to the control curve in grey.

