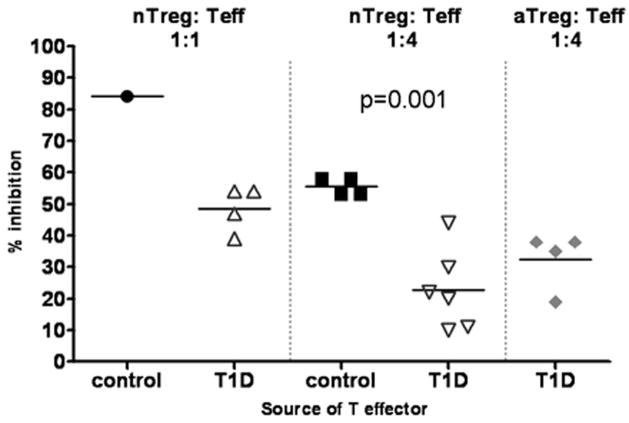
Figure 3.
T1D Teff are resistant to nTreg. T1D Teff were co-incubated with nTreg directly isolated from the peripheral blood, %inhibition at a Treg:Teff ratio of 1:1 is shown for, nTreg with control Teff (●) (n=1) and nTreg with T1D Teff (△) (n=4) at a Treg:Teff ratio of 1:1, nTreg with control Teff (■) (n=4) and nTreg with T1D Teff (▽) (n=6) at a ratio of 1:4. For comparison the level of suppression at 1:4 seen with control aTreg co-incubated with the same T1D Teff cells shown in the nTreg assays is shown (
 ).
).

